Spanish vs Immigrants from Switzerland Single Female Poverty
COMPARE
Spanish
Immigrants from Switzerland
Single Female Poverty
Single Female Poverty Comparison
Spanish
Immigrants from Switzerland
22.0%
SINGLE FEMALE POVERTY
4.7/ 100
METRIC RATING
234th/ 347
METRIC RANK
20.0%
SINGLE FEMALE POVERTY
95.1/ 100
METRIC RATING
121st/ 347
METRIC RANK
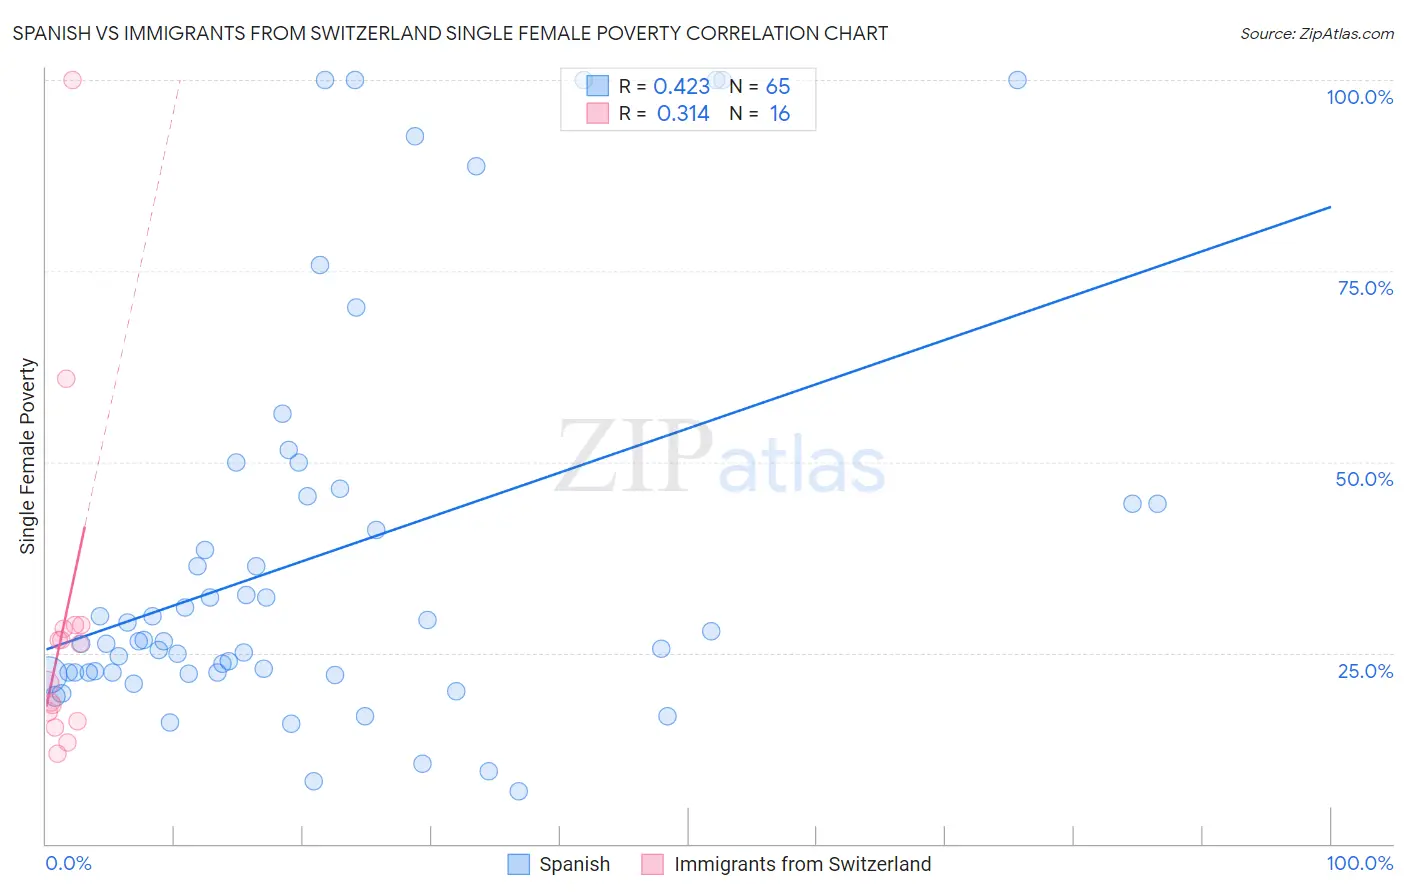
Spanish vs Immigrants from Switzerland Single Female Poverty Correlation Chart
The statistical analysis conducted on geographies consisting of 415,535,670 people shows a moderate positive correlation between the proportion of Spanish and poverty level among single females in the United States with a correlation coefficient (R) of 0.423 and weighted average of 22.0%. Similarly, the statistical analysis conducted on geographies consisting of 146,751,859 people shows a mild positive correlation between the proportion of Immigrants from Switzerland and poverty level among single females in the United States with a correlation coefficient (R) of 0.314 and weighted average of 20.0%, a difference of 9.7%.
Single Female Poverty Correlation Summary
| Measurement | Spanish | Immigrants from Switzerland |
| Minimum | 6.8% | 11.7% |
| Maximum | 100.0% | 100.0% |
| Range | 93.2% | 88.3% |
| Mean | 37.7% | 28.5% |
| Median | 26.5% | 23.5% |
| Interquartile 25% (IQ1) | 22.4% | 16.6% |
| Interquartile 75% (IQ3) | 45.0% | 28.3% |
| Interquartile Range (IQR) | 22.6% | 11.7% |
| Standard Deviation (Sample) | 26.1% | 22.2% |
| Standard Deviation (Population) | 25.9% | 21.5% |
Similar Demographics by Single Female Poverty
Demographics Similar to Spanish by Single Female Poverty
In terms of single female poverty, the demographic groups most similar to Spanish are Spaniard (22.0%, a difference of 0.0%), Dutch (22.0%, a difference of 0.020%), Immigrants from Thailand (22.0%, a difference of 0.10%), Welsh (22.0%, a difference of 0.11%), and Immigrants from Ecuador (22.0%, a difference of 0.18%).
| Demographics | Rating | Rank | Single Female Poverty |
| Immigrants | Ghana | 5.8 /100 | #227 | Tragic 21.9% |
| Salvadorans | 5.5 /100 | #228 | Tragic 21.9% |
| Tlingit-Haida | 5.4 /100 | #229 | Tragic 21.9% |
| Immigrants | Western Africa | 5.3 /100 | #230 | Tragic 22.0% |
| Welsh | 5.0 /100 | #231 | Tragic 22.0% |
| Immigrants | Thailand | 5.0 /100 | #232 | Tragic 22.0% |
| Spaniards | 4.7 /100 | #233 | Tragic 22.0% |
| Spanish | 4.7 /100 | #234 | Tragic 22.0% |
| Dutch | 4.6 /100 | #235 | Tragic 22.0% |
| Immigrants | Ecuador | 4.2 /100 | #236 | Tragic 22.0% |
| Vietnamese | 4.0 /100 | #237 | Tragic 22.0% |
| French Canadians | 2.8 /100 | #238 | Tragic 22.2% |
| Malaysians | 2.8 /100 | #239 | Tragic 22.2% |
| French | 2.3 /100 | #240 | Tragic 22.2% |
| Cape Verdeans | 2.1 /100 | #241 | Tragic 22.3% |
Demographics Similar to Immigrants from Switzerland by Single Female Poverty
In terms of single female poverty, the demographic groups most similar to Immigrants from Switzerland are South American (20.0%, a difference of 0.030%), Immigrants from South America (20.0%, a difference of 0.030%), Immigrants from Afghanistan (20.0%, a difference of 0.13%), Immigrants from Ethiopia (20.0%, a difference of 0.13%), and Polish (20.0%, a difference of 0.20%).
| Demographics | Rating | Rank | Single Female Poverty |
| Immigrants | Colombia | 95.9 /100 | #114 | Exceptional 20.0% |
| Immigrants | Northern Africa | 95.8 /100 | #115 | Exceptional 20.0% |
| Immigrants | Kazakhstan | 95.7 /100 | #116 | Exceptional 20.0% |
| Poles | 95.6 /100 | #117 | Exceptional 20.0% |
| Immigrants | Afghanistan | 95.4 /100 | #118 | Exceptional 20.0% |
| Immigrants | Ethiopia | 95.4 /100 | #119 | Exceptional 20.0% |
| South Americans | 95.1 /100 | #120 | Exceptional 20.0% |
| Immigrants | Switzerland | 95.1 /100 | #121 | Exceptional 20.0% |
| Immigrants | South America | 95.0 /100 | #122 | Exceptional 20.0% |
| Brazilians | 94.4 /100 | #123 | Exceptional 20.1% |
| Immigrants | Chile | 94.3 /100 | #124 | Exceptional 20.1% |
| Immigrants | South Africa | 93.9 /100 | #125 | Exceptional 20.1% |
| Serbians | 93.3 /100 | #126 | Exceptional 20.1% |
| Mongolians | 93.2 /100 | #127 | Exceptional 20.2% |
| Immigrants | Spain | 92.7 /100 | #128 | Exceptional 20.2% |