Navajo vs Immigrants from Switzerland Single Female Poverty
COMPARE
Navajo
Immigrants from Switzerland
Single Female Poverty
Single Female Poverty Comparison
Navajo
Immigrants from Switzerland
31.7%
SINGLE FEMALE POVERTY
0.0/ 100
METRIC RATING
342nd/ 347
METRIC RANK
20.0%
SINGLE FEMALE POVERTY
95.1/ 100
METRIC RATING
121st/ 347
METRIC RANK
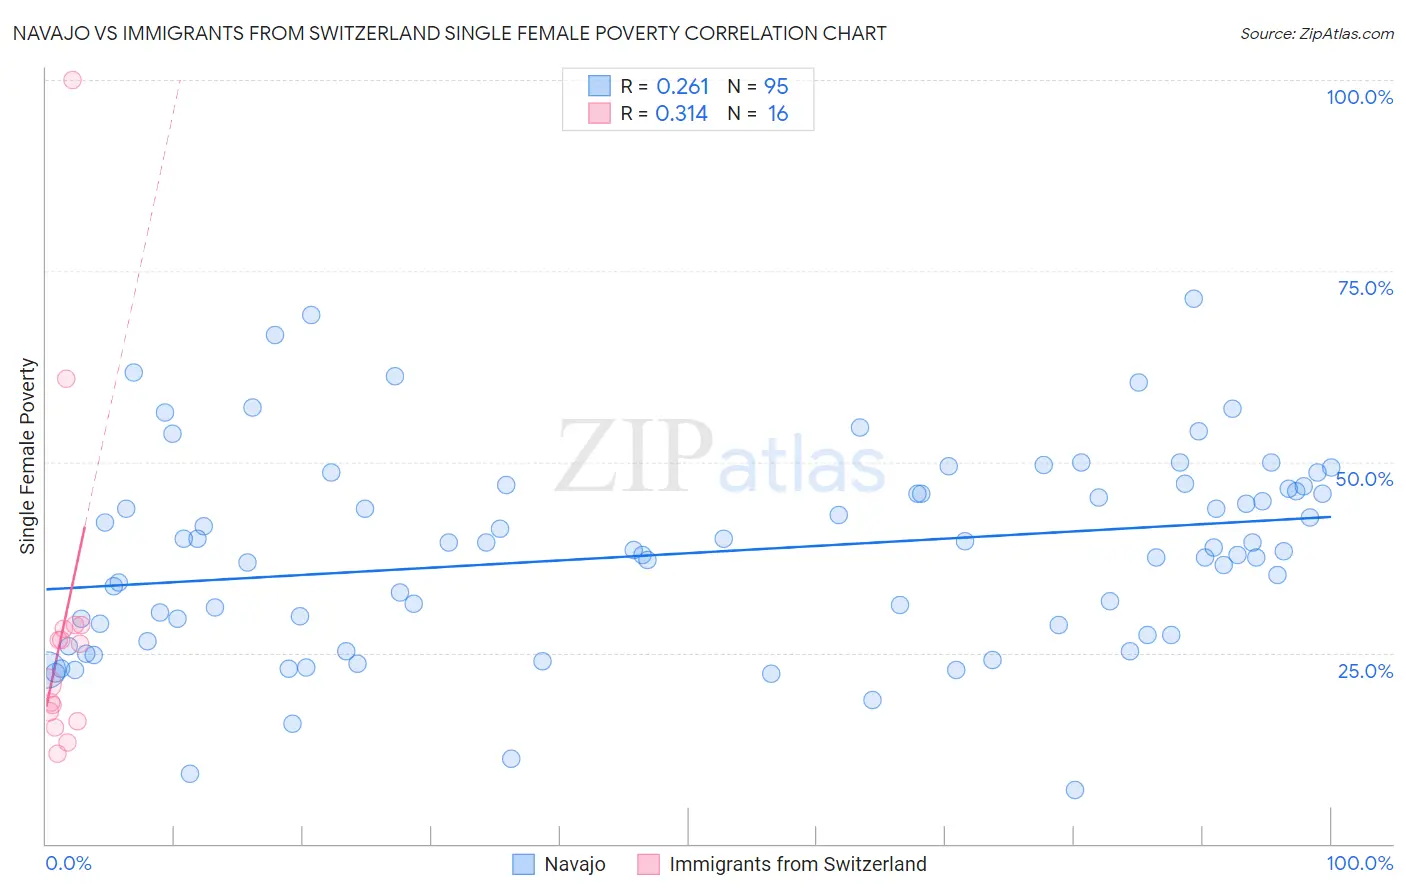
Navajo vs Immigrants from Switzerland Single Female Poverty Correlation Chart
The statistical analysis conducted on geographies consisting of 223,343,663 people shows a weak positive correlation between the proportion of Navajo and poverty level among single females in the United States with a correlation coefficient (R) of 0.261 and weighted average of 31.7%. Similarly, the statistical analysis conducted on geographies consisting of 146,751,859 people shows a mild positive correlation between the proportion of Immigrants from Switzerland and poverty level among single females in the United States with a correlation coefficient (R) of 0.314 and weighted average of 20.0%, a difference of 58.0%.
Single Female Poverty Correlation Summary
| Measurement | Navajo | Immigrants from Switzerland |
| Minimum | 7.0% | 11.7% |
| Maximum | 71.4% | 100.0% |
| Range | 64.4% | 88.3% |
| Mean | 38.1% | 28.5% |
| Median | 38.5% | 23.5% |
| Interquartile 25% (IQ1) | 27.3% | 16.6% |
| Interquartile 75% (IQ3) | 46.5% | 28.3% |
| Interquartile Range (IQR) | 19.3% | 11.7% |
| Standard Deviation (Sample) | 13.1% | 22.2% |
| Standard Deviation (Population) | 13.0% | 21.5% |
Similar Demographics by Single Female Poverty
Demographics Similar to Navajo by Single Female Poverty
In terms of single female poverty, the demographic groups most similar to Navajo are Sioux (31.3%, a difference of 1.3%), Crow (32.4%, a difference of 2.4%), Cajun (30.6%, a difference of 3.3%), Cheyenne (30.4%, a difference of 4.1%), and Lumbee (33.0%, a difference of 4.3%).
| Demographics | Rating | Rank | Single Female Poverty |
| Ute | 0.0 /100 | #333 | Tragic 28.4% |
| Pueblo | 0.0 /100 | #334 | Tragic 28.6% |
| Immigrants | Yemen | 0.0 /100 | #335 | Tragic 28.9% |
| Colville | 0.0 /100 | #336 | Tragic 29.1% |
| Yuman | 0.0 /100 | #337 | Tragic 29.4% |
| Pima | 0.0 /100 | #338 | Tragic 30.3% |
| Cheyenne | 0.0 /100 | #339 | Tragic 30.4% |
| Cajuns | 0.0 /100 | #340 | Tragic 30.6% |
| Sioux | 0.0 /100 | #341 | Tragic 31.3% |
| Navajo | 0.0 /100 | #342 | Tragic 31.7% |
| Crow | 0.0 /100 | #343 | Tragic 32.4% |
| Lumbee | 0.0 /100 | #344 | Tragic 33.0% |
| Houma | 0.0 /100 | #345 | Tragic 33.8% |
| Puerto Ricans | 0.0 /100 | #346 | Tragic 34.1% |
| Tohono O'odham | 0.0 /100 | #347 | Tragic 34.2% |
Demographics Similar to Immigrants from Switzerland by Single Female Poverty
In terms of single female poverty, the demographic groups most similar to Immigrants from Switzerland are South American (20.0%, a difference of 0.030%), Immigrants from South America (20.0%, a difference of 0.030%), Immigrants from Afghanistan (20.0%, a difference of 0.13%), Immigrants from Ethiopia (20.0%, a difference of 0.13%), and Polish (20.0%, a difference of 0.20%).
| Demographics | Rating | Rank | Single Female Poverty |
| Immigrants | Colombia | 95.9 /100 | #114 | Exceptional 20.0% |
| Immigrants | Northern Africa | 95.8 /100 | #115 | Exceptional 20.0% |
| Immigrants | Kazakhstan | 95.7 /100 | #116 | Exceptional 20.0% |
| Poles | 95.6 /100 | #117 | Exceptional 20.0% |
| Immigrants | Afghanistan | 95.4 /100 | #118 | Exceptional 20.0% |
| Immigrants | Ethiopia | 95.4 /100 | #119 | Exceptional 20.0% |
| South Americans | 95.1 /100 | #120 | Exceptional 20.0% |
| Immigrants | Switzerland | 95.1 /100 | #121 | Exceptional 20.0% |
| Immigrants | South America | 95.0 /100 | #122 | Exceptional 20.0% |
| Brazilians | 94.4 /100 | #123 | Exceptional 20.1% |
| Immigrants | Chile | 94.3 /100 | #124 | Exceptional 20.1% |
| Immigrants | South Africa | 93.9 /100 | #125 | Exceptional 20.1% |
| Serbians | 93.3 /100 | #126 | Exceptional 20.1% |
| Mongolians | 93.2 /100 | #127 | Exceptional 20.2% |
| Immigrants | Spain | 92.7 /100 | #128 | Exceptional 20.2% |