Danish vs Yugoslavian Single Male Poverty
COMPARE
Danish
Yugoslavian
Single Male Poverty
Single Male Poverty Comparison
Danes
Yugoslavians
12.8%
SINGLE MALE POVERTY
51.4/ 100
METRIC RATING
172nd/ 347
METRIC RANK
12.6%
SINGLE MALE POVERTY
73.9/ 100
METRIC RATING
148th/ 347
METRIC RANK
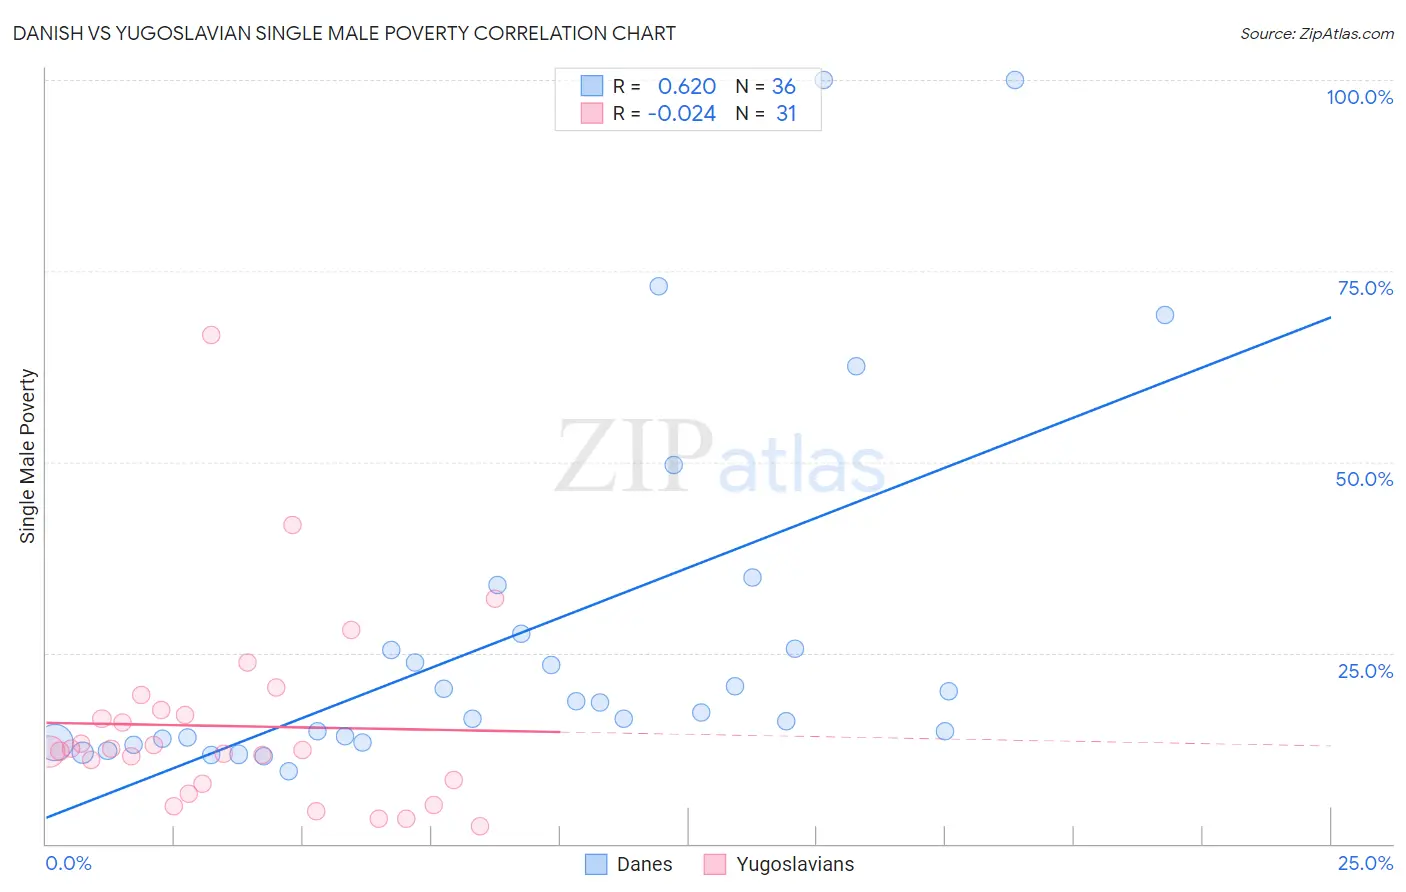
Danish vs Yugoslavian Single Male Poverty Correlation Chart
The statistical analysis conducted on geographies consisting of 403,172,757 people shows a significant positive correlation between the proportion of Danes and poverty level among single males in the United States with a correlation coefficient (R) of 0.620 and weighted average of 12.8%. Similarly, the statistical analysis conducted on geographies consisting of 258,600,754 people shows no correlation between the proportion of Yugoslavians and poverty level among single males in the United States with a correlation coefficient (R) of -0.024 and weighted average of 12.6%, a difference of 1.3%.
Single Male Poverty Correlation Summary
| Measurement | Danish | Yugoslavian |
| Minimum | 9.5% | 2.3% |
| Maximum | 100.0% | 66.7% |
| Range | 90.5% | 64.4% |
| Mean | 27.5% | 15.4% |
| Median | 17.9% | 12.3% |
| Interquartile 25% (IQ1) | 13.5% | 7.9% |
| Interquartile 75% (IQ3) | 26.5% | 17.6% |
| Interquartile Range (IQR) | 13.0% | 9.7% |
| Standard Deviation (Sample) | 23.9% | 12.9% |
| Standard Deviation (Population) | 23.6% | 12.7% |
Similar Demographics by Single Male Poverty
Demographics Similar to Danes by Single Male Poverty
In terms of single male poverty, the demographic groups most similar to Danes are South African (12.8%, a difference of 0.0%), Guyanese (12.8%, a difference of 0.030%), Immigrants from St. Vincent and the Grenadines (12.8%, a difference of 0.030%), Costa Rican (12.8%, a difference of 0.080%), and Croatian (12.8%, a difference of 0.14%).
| Demographics | Rating | Rank | Single Male Poverty |
| Immigrants | Cambodia | 62.2 /100 | #165 | Good 12.7% |
| Immigrants | Guyana | 60.5 /100 | #166 | Good 12.7% |
| Immigrants | Sudan | 58.2 /100 | #167 | Average 12.7% |
| Immigrants | Barbados | 57.7 /100 | #168 | Average 12.7% |
| Puget Sound Salish | 54.3 /100 | #169 | Average 12.8% |
| Guyanese | 52.0 /100 | #170 | Average 12.8% |
| South Africans | 51.5 /100 | #171 | Average 12.8% |
| Danes | 51.4 /100 | #172 | Average 12.8% |
| Immigrants | St. Vincent and the Grenadines | 50.9 /100 | #173 | Average 12.8% |
| Costa Ricans | 50.0 /100 | #174 | Average 12.8% |
| Croatians | 48.9 /100 | #175 | Average 12.8% |
| Syrians | 48.4 /100 | #176 | Average 12.8% |
| Immigrants | Canada | 44.8 /100 | #177 | Average 12.8% |
| Immigrants | Switzerland | 43.1 /100 | #178 | Average 12.8% |
| Israelis | 41.0 /100 | #179 | Average 12.9% |
Demographics Similar to Yugoslavians by Single Male Poverty
In terms of single male poverty, the demographic groups most similar to Yugoslavians are Malaysian (12.6%, a difference of 0.060%), Immigrants from Lebanon (12.6%, a difference of 0.070%), Native Hawaiian (12.6%, a difference of 0.070%), Sierra Leonean (12.6%, a difference of 0.070%), and Hawaiian (12.6%, a difference of 0.080%).
| Demographics | Rating | Rank | Single Male Poverty |
| Okinawans | 75.9 /100 | #141 | Good 12.6% |
| Immigrants | Uganda | 75.9 /100 | #142 | Good 12.6% |
| Immigrants | France | 75.8 /100 | #143 | Good 12.6% |
| Hawaiians | 75.1 /100 | #144 | Good 12.6% |
| Immigrants | Lebanon | 75.0 /100 | #145 | Good 12.6% |
| Native Hawaiians | 75.0 /100 | #146 | Good 12.6% |
| Malaysians | 74.8 /100 | #147 | Good 12.6% |
| Yugoslavians | 73.9 /100 | #148 | Good 12.6% |
| Sierra Leoneans | 73.0 /100 | #149 | Good 12.6% |
| Immigrants | Panama | 72.1 /100 | #150 | Good 12.6% |
| Immigrants | Hungary | 71.9 /100 | #151 | Good 12.6% |
| Australians | 71.4 /100 | #152 | Good 12.6% |
| Immigrants | Immigrants | 70.1 /100 | #153 | Good 12.7% |
| Immigrants | Scotland | 68.9 /100 | #154 | Good 12.7% |
| Immigrants | Spain | 68.7 /100 | #155 | Good 12.7% |