Indian (Asian) vs Yugoslavian Single Male Poverty
COMPARE
Indian (Asian)
Yugoslavian
Single Male Poverty
Single Male Poverty Comparison
Indians (Asian)
Yugoslavians
11.3%
SINGLE MALE POVERTY
100.0/ 100
METRIC RATING
24th/ 347
METRIC RANK
12.6%
SINGLE MALE POVERTY
73.9/ 100
METRIC RATING
148th/ 347
METRIC RANK
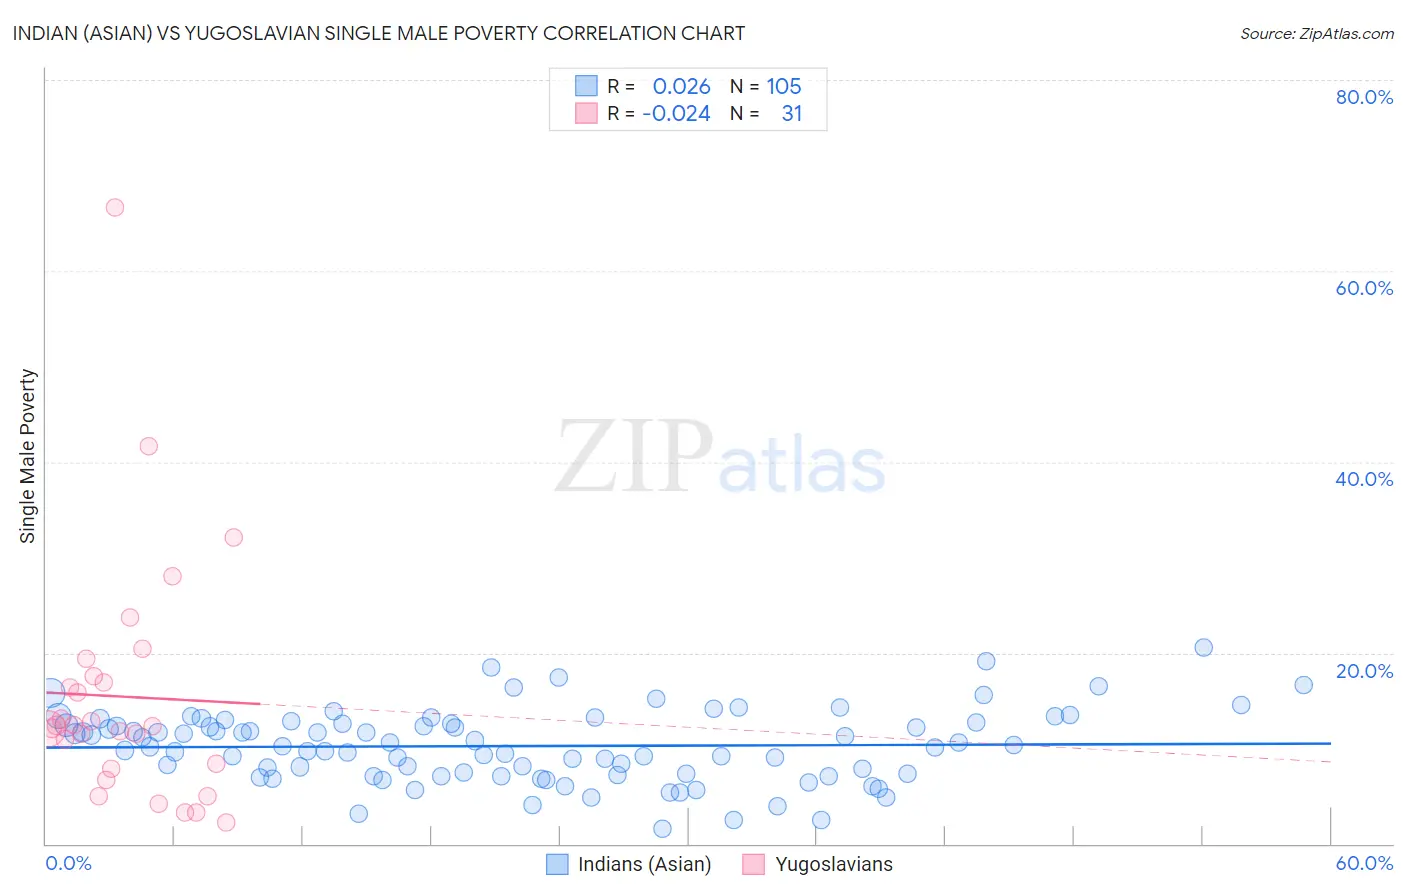
Indian (Asian) vs Yugoslavian Single Male Poverty Correlation Chart
The statistical analysis conducted on geographies consisting of 425,562,550 people shows no correlation between the proportion of Indians (Asian) and poverty level among single males in the United States with a correlation coefficient (R) of 0.026 and weighted average of 11.3%. Similarly, the statistical analysis conducted on geographies consisting of 258,600,754 people shows no correlation between the proportion of Yugoslavians and poverty level among single males in the United States with a correlation coefficient (R) of -0.024 and weighted average of 12.6%, a difference of 12.1%.
Single Male Poverty Correlation Summary
| Measurement | Indian (Asian) | Yugoslavian |
| Minimum | 1.5% | 2.3% |
| Maximum | 20.6% | 66.7% |
| Range | 19.1% | 64.4% |
| Mean | 10.2% | 15.4% |
| Median | 10.3% | 12.3% |
| Interquartile 25% (IQ1) | 7.2% | 7.9% |
| Interquartile 75% (IQ3) | 12.7% | 17.6% |
| Interquartile Range (IQR) | 5.5% | 9.7% |
| Standard Deviation (Sample) | 3.8% | 12.9% |
| Standard Deviation (Population) | 3.7% | 12.7% |
Similar Demographics by Single Male Poverty
Demographics Similar to Indians (Asian) by Single Male Poverty
In terms of single male poverty, the demographic groups most similar to Indians (Asian) are Maltese (11.3%, a difference of 0.020%), Bolivian (11.2%, a difference of 0.20%), Immigrants from Japan (11.3%, a difference of 0.35%), Immigrants from Pakistan (11.2%, a difference of 0.41%), and Asian (11.2%, a difference of 0.50%).
| Demographics | Rating | Rank | Single Male Poverty |
| Tsimshian | 100.0 /100 | #17 | Exceptional 11.1% |
| Immigrants | Bolivia | 100.0 /100 | #18 | Exceptional 11.1% |
| Immigrants | Moldova | 100.0 /100 | #19 | Exceptional 11.2% |
| Ethiopians | 100.0 /100 | #20 | Exceptional 11.2% |
| Asians | 100.0 /100 | #21 | Exceptional 11.2% |
| Immigrants | Pakistan | 100.0 /100 | #22 | Exceptional 11.2% |
| Bolivians | 100.0 /100 | #23 | Exceptional 11.2% |
| Indians (Asian) | 100.0 /100 | #24 | Exceptional 11.3% |
| Maltese | 100.0 /100 | #25 | Exceptional 11.3% |
| Immigrants | Japan | 100.0 /100 | #26 | Exceptional 11.3% |
| Immigrants | China | 100.0 /100 | #27 | Exceptional 11.4% |
| Immigrants | Asia | 100.0 /100 | #28 | Exceptional 11.4% |
| Immigrants | Egypt | 100.0 /100 | #29 | Exceptional 11.4% |
| Iranians | 100.0 /100 | #30 | Exceptional 11.4% |
| Immigrants | Iran | 100.0 /100 | #31 | Exceptional 11.4% |
Demographics Similar to Yugoslavians by Single Male Poverty
In terms of single male poverty, the demographic groups most similar to Yugoslavians are Malaysian (12.6%, a difference of 0.060%), Immigrants from Lebanon (12.6%, a difference of 0.070%), Native Hawaiian (12.6%, a difference of 0.070%), Sierra Leonean (12.6%, a difference of 0.070%), and Hawaiian (12.6%, a difference of 0.080%).
| Demographics | Rating | Rank | Single Male Poverty |
| Okinawans | 75.9 /100 | #141 | Good 12.6% |
| Immigrants | Uganda | 75.9 /100 | #142 | Good 12.6% |
| Immigrants | France | 75.8 /100 | #143 | Good 12.6% |
| Hawaiians | 75.1 /100 | #144 | Good 12.6% |
| Immigrants | Lebanon | 75.0 /100 | #145 | Good 12.6% |
| Native Hawaiians | 75.0 /100 | #146 | Good 12.6% |
| Malaysians | 74.8 /100 | #147 | Good 12.6% |
| Yugoslavians | 73.9 /100 | #148 | Good 12.6% |
| Sierra Leoneans | 73.0 /100 | #149 | Good 12.6% |
| Immigrants | Panama | 72.1 /100 | #150 | Good 12.6% |
| Immigrants | Hungary | 71.9 /100 | #151 | Good 12.6% |
| Australians | 71.4 /100 | #152 | Good 12.6% |
| Immigrants | Immigrants | 70.1 /100 | #153 | Good 12.7% |
| Immigrants | Scotland | 68.9 /100 | #154 | Good 12.7% |
| Immigrants | Spain | 68.7 /100 | #155 | Good 12.7% |