Immigrants from Guyana vs Yugoslavian Single Male Poverty
COMPARE
Immigrants from Guyana
Yugoslavian
Single Male Poverty
Single Male Poverty Comparison
Immigrants from Guyana
Yugoslavians
12.7%
SINGLE MALE POVERTY
60.5/ 100
METRIC RATING
166th/ 347
METRIC RANK
12.6%
SINGLE MALE POVERTY
73.9/ 100
METRIC RATING
148th/ 347
METRIC RANK
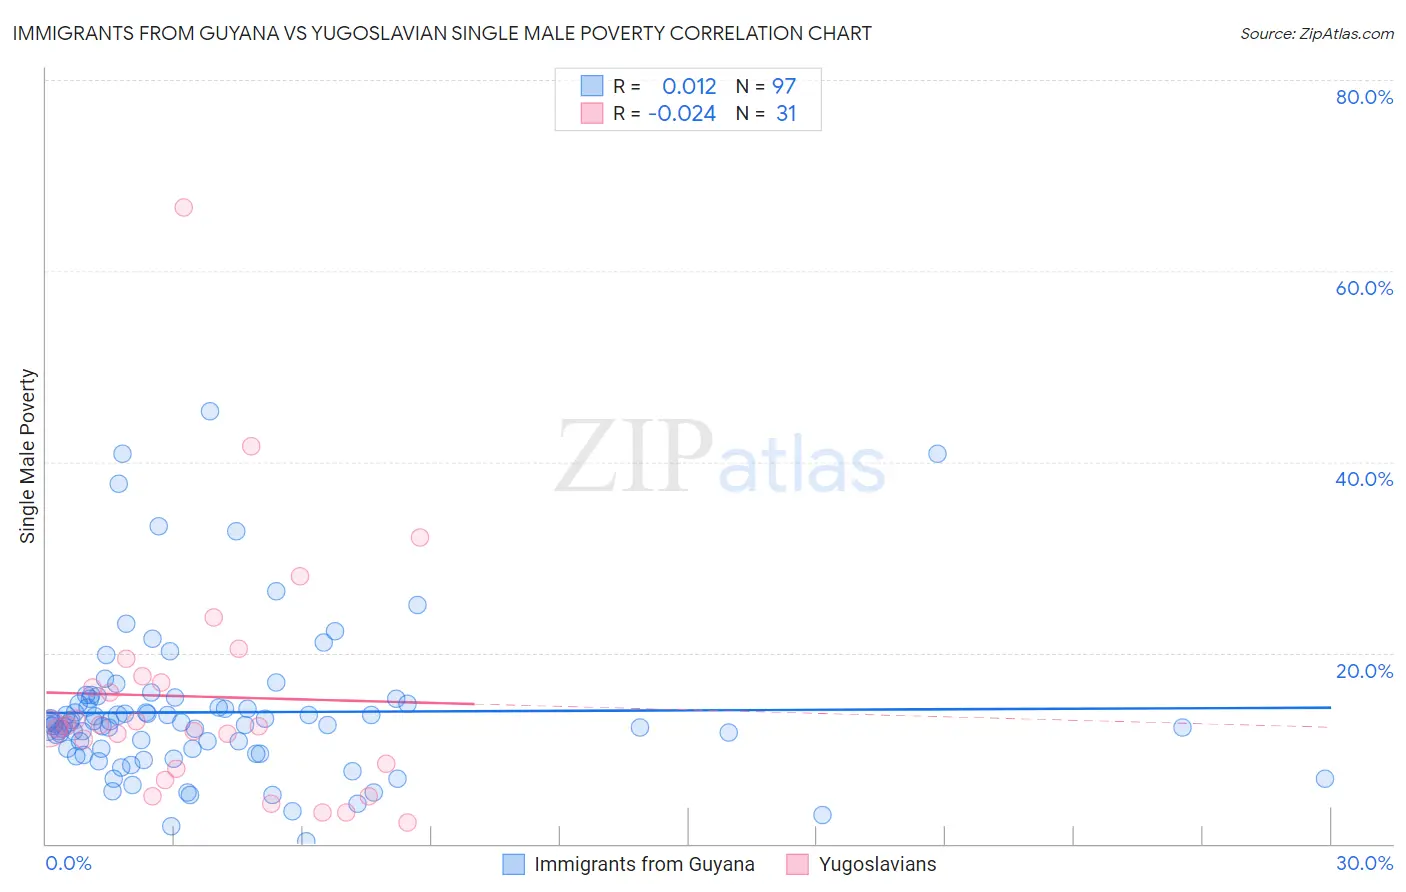
Immigrants from Guyana vs Yugoslavian Single Male Poverty Correlation Chart
The statistical analysis conducted on geographies consisting of 169,877,868 people shows no correlation between the proportion of Immigrants from Guyana and poverty level among single males in the United States with a correlation coefficient (R) of 0.012 and weighted average of 12.7%. Similarly, the statistical analysis conducted on geographies consisting of 258,600,754 people shows no correlation between the proportion of Yugoslavians and poverty level among single males in the United States with a correlation coefficient (R) of -0.024 and weighted average of 12.6%, a difference of 0.82%.
Single Male Poverty Correlation Summary
| Measurement | Immigrants from Guyana | Yugoslavian |
| Minimum | 0.23% | 2.3% |
| Maximum | 45.3% | 66.7% |
| Range | 45.1% | 64.4% |
| Mean | 13.8% | 15.4% |
| Median | 12.6% | 12.3% |
| Interquartile 25% (IQ1) | 9.7% | 7.9% |
| Interquartile 75% (IQ3) | 14.9% | 17.6% |
| Interquartile Range (IQR) | 5.2% | 9.7% |
| Standard Deviation (Sample) | 7.9% | 12.9% |
| Standard Deviation (Population) | 7.9% | 12.7% |
Demographics Similar to Immigrants from Guyana and Yugoslavians by Single Male Poverty
In terms of single male poverty, the demographic groups most similar to Immigrants from Guyana are Immigrants from Cambodia (12.7%, a difference of 0.090%), Immigrants from Nigeria (12.7%, a difference of 0.13%), Immigrants from Sudan (12.7%, a difference of 0.13%), Palestinian (12.7%, a difference of 0.14%), and Immigrants from Africa (12.7%, a difference of 0.16%). Similarly, the demographic groups most similar to Yugoslavians are Malaysian (12.6%, a difference of 0.060%), Sierra Leonean (12.6%, a difference of 0.070%), Immigrants from Panama (12.6%, a difference of 0.13%), Immigrants from Hungary (12.6%, a difference of 0.14%), and Australian (12.6%, a difference of 0.17%).
| Demographics | Rating | Rank | Single Male Poverty |
| Malaysians | 74.8 /100 | #147 | Good 12.6% |
| Yugoslavians | 73.9 /100 | #148 | Good 12.6% |
| Sierra Leoneans | 73.0 /100 | #149 | Good 12.6% |
| Immigrants | Panama | 72.1 /100 | #150 | Good 12.6% |
| Immigrants | Hungary | 71.9 /100 | #151 | Good 12.6% |
| Australians | 71.4 /100 | #152 | Good 12.6% |
| Immigrants | Immigrants | 70.1 /100 | #153 | Good 12.7% |
| Immigrants | Scotland | 68.9 /100 | #154 | Good 12.7% |
| Immigrants | Spain | 68.7 /100 | #155 | Good 12.7% |
| Vietnamese | 67.9 /100 | #156 | Good 12.7% |
| Latvians | 67.9 /100 | #157 | Good 12.7% |
| Immigrants | Middle Africa | 64.9 /100 | #158 | Good 12.7% |
| Immigrants | Liberia | 64.2 /100 | #159 | Good 12.7% |
| Greeks | 64.1 /100 | #160 | Good 12.7% |
| Immigrants | Africa | 63.4 /100 | #161 | Good 12.7% |
| Eastern Europeans | 63.3 /100 | #162 | Good 12.7% |
| Palestinians | 63.1 /100 | #163 | Good 12.7% |
| Immigrants | Nigeria | 62.8 /100 | #164 | Good 12.7% |
| Immigrants | Cambodia | 62.2 /100 | #165 | Good 12.7% |
| Immigrants | Guyana | 60.5 /100 | #166 | Good 12.7% |
| Immigrants | Sudan | 58.2 /100 | #167 | Average 12.7% |