Celtic vs Palestinian Single Female Poverty
COMPARE
Celtic
Palestinian
Single Female Poverty
Single Female Poverty Comparison
Celtics
Palestinians
22.7%
SINGLE FEMALE POVERTY
0.5/ 100
METRIC RATING
260th/ 347
METRIC RANK
19.2%
SINGLE FEMALE POVERTY
99.6/ 100
METRIC RATING
66th/ 347
METRIC RANK
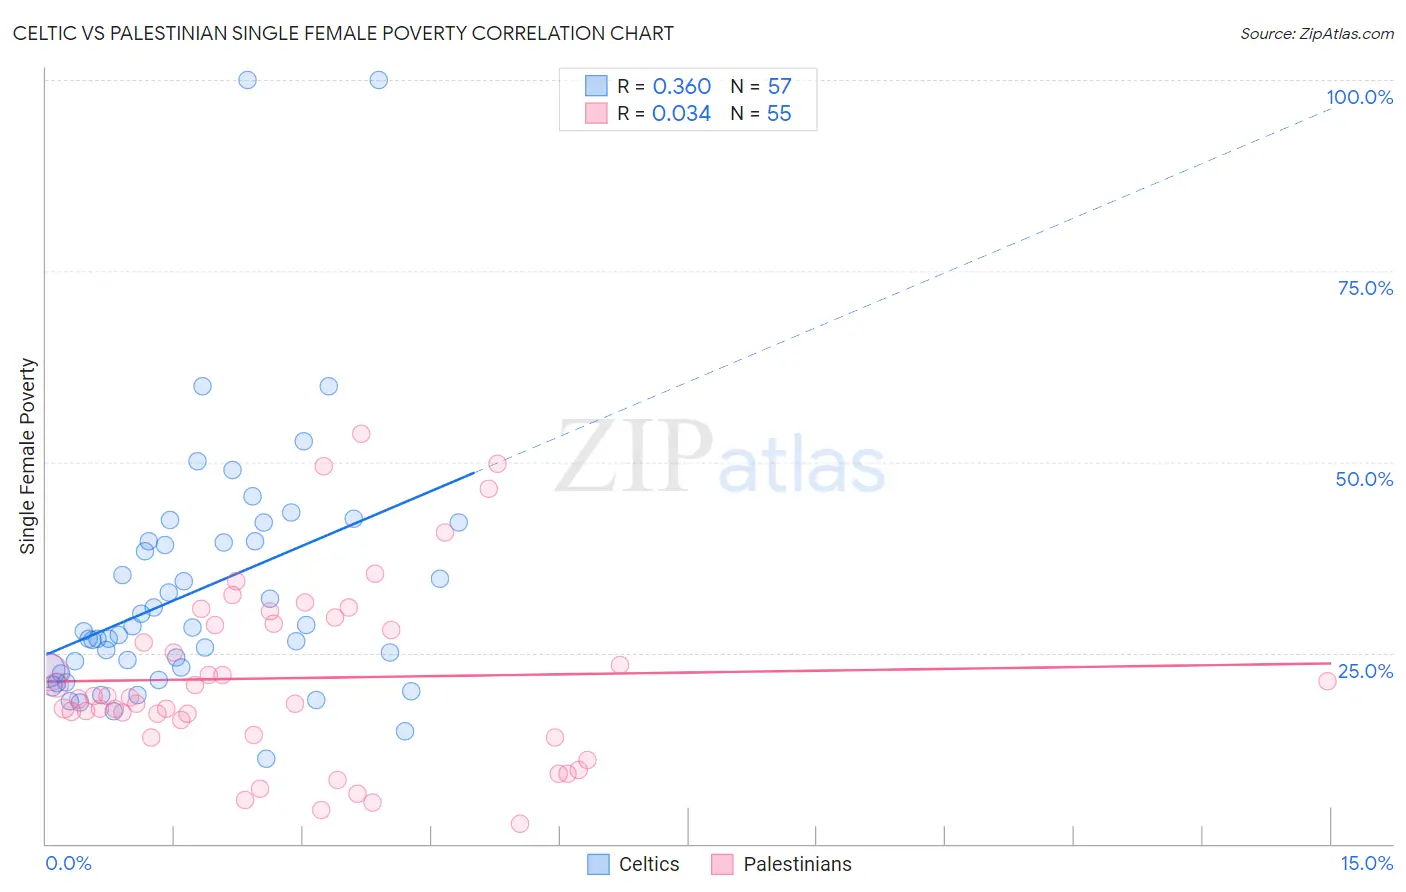
Celtic vs Palestinian Single Female Poverty Correlation Chart
The statistical analysis conducted on geographies consisting of 167,592,415 people shows a mild positive correlation between the proportion of Celtics and poverty level among single females in the United States with a correlation coefficient (R) of 0.360 and weighted average of 22.7%. Similarly, the statistical analysis conducted on geographies consisting of 214,894,692 people shows no correlation between the proportion of Palestinians and poverty level among single females in the United States with a correlation coefficient (R) of 0.034 and weighted average of 19.2%, a difference of 18.1%.
Single Female Poverty Correlation Summary
| Measurement | Celtic | Palestinian |
| Minimum | 11.1% | 2.6% |
| Maximum | 100.0% | 53.6% |
| Range | 88.9% | 51.0% |
| Mean | 33.1% | 21.7% |
| Median | 27.8% | 19.1% |
| Interquartile 25% (IQ1) | 22.5% | 14.2% |
| Interquartile 75% (IQ3) | 39.6% | 28.9% |
| Interquartile Range (IQR) | 17.1% | 14.7% |
| Standard Deviation (Sample) | 16.9% | 11.7% |
| Standard Deviation (Population) | 16.7% | 11.6% |
Similar Demographics by Single Female Poverty
Demographics Similar to Celtics by Single Female Poverty
In terms of single female poverty, the demographic groups most similar to Celtics are White/Caucasian (22.7%, a difference of 0.080%), Bahamian (22.7%, a difference of 0.21%), Immigrants from Cabo Verde (22.8%, a difference of 0.27%), Sudanese (22.6%, a difference of 0.41%), and British West Indian (22.8%, a difference of 0.52%).
| Demographics | Rating | Rank | Single Female Poverty |
| Immigrants | Liberia | 0.9 /100 | #253 | Tragic 22.5% |
| Immigrants | Burma/Myanmar | 0.8 /100 | #254 | Tragic 22.6% |
| Immigrants | Sudan | 0.8 /100 | #255 | Tragic 22.6% |
| Immigrants | Belize | 0.8 /100 | #256 | Tragic 22.6% |
| Sudanese | 0.7 /100 | #257 | Tragic 22.6% |
| Bahamians | 0.6 /100 | #258 | Tragic 22.7% |
| Whites/Caucasians | 0.6 /100 | #259 | Tragic 22.7% |
| Celtics | 0.5 /100 | #260 | Tragic 22.7% |
| Immigrants | Cabo Verde | 0.4 /100 | #261 | Tragic 22.8% |
| British West Indians | 0.4 /100 | #262 | Tragic 22.8% |
| Scotch-Irish | 0.3 /100 | #263 | Tragic 22.9% |
| Immigrants | Laos | 0.3 /100 | #264 | Tragic 22.9% |
| Central Americans | 0.2 /100 | #265 | Tragic 23.0% |
| Immigrants | Micronesia | 0.2 /100 | #266 | Tragic 23.0% |
| Senegalese | 0.2 /100 | #267 | Tragic 23.0% |
Demographics Similar to Palestinians by Single Female Poverty
In terms of single female poverty, the demographic groups most similar to Palestinians are Cypriot (19.2%, a difference of 0.020%), Immigrants from Europe (19.2%, a difference of 0.040%), Immigrants from Egypt (19.2%, a difference of 0.040%), Immigrants from Northern Europe (19.2%, a difference of 0.050%), and Laotian (19.3%, a difference of 0.080%).
| Demographics | Rating | Rank | Single Female Poverty |
| Sri Lankans | 99.6 /100 | #59 | Exceptional 19.2% |
| Russians | 99.6 /100 | #60 | Exceptional 19.2% |
| Cambodians | 99.6 /100 | #61 | Exceptional 19.2% |
| Lithuanians | 99.6 /100 | #62 | Exceptional 19.2% |
| Immigrants | Northern Europe | 99.6 /100 | #63 | Exceptional 19.2% |
| Immigrants | Europe | 99.6 /100 | #64 | Exceptional 19.2% |
| Cypriots | 99.6 /100 | #65 | Exceptional 19.2% |
| Palestinians | 99.6 /100 | #66 | Exceptional 19.2% |
| Immigrants | Egypt | 99.6 /100 | #67 | Exceptional 19.2% |
| Laotians | 99.5 /100 | #68 | Exceptional 19.3% |
| Paraguayans | 99.5 /100 | #69 | Exceptional 19.3% |
| Immigrants | Jordan | 99.4 /100 | #70 | Exceptional 19.3% |
| Immigrants | South Eastern Asia | 99.4 /100 | #71 | Exceptional 19.3% |
| Immigrants | Latvia | 99.4 /100 | #72 | Exceptional 19.3% |
| Immigrants | Peru | 99.4 /100 | #73 | Exceptional 19.3% |