Immigrants from Eastern Asia vs Palestinian Single Female Poverty
COMPARE
Immigrants from Eastern Asia
Palestinian
Single Female Poverty
Single Female Poverty Comparison
Immigrants from Eastern Asia
Palestinians
18.1%
SINGLE FEMALE POVERTY
100.0/ 100
METRIC RATING
18th/ 347
METRIC RANK
19.2%
SINGLE FEMALE POVERTY
99.6/ 100
METRIC RATING
66th/ 347
METRIC RANK
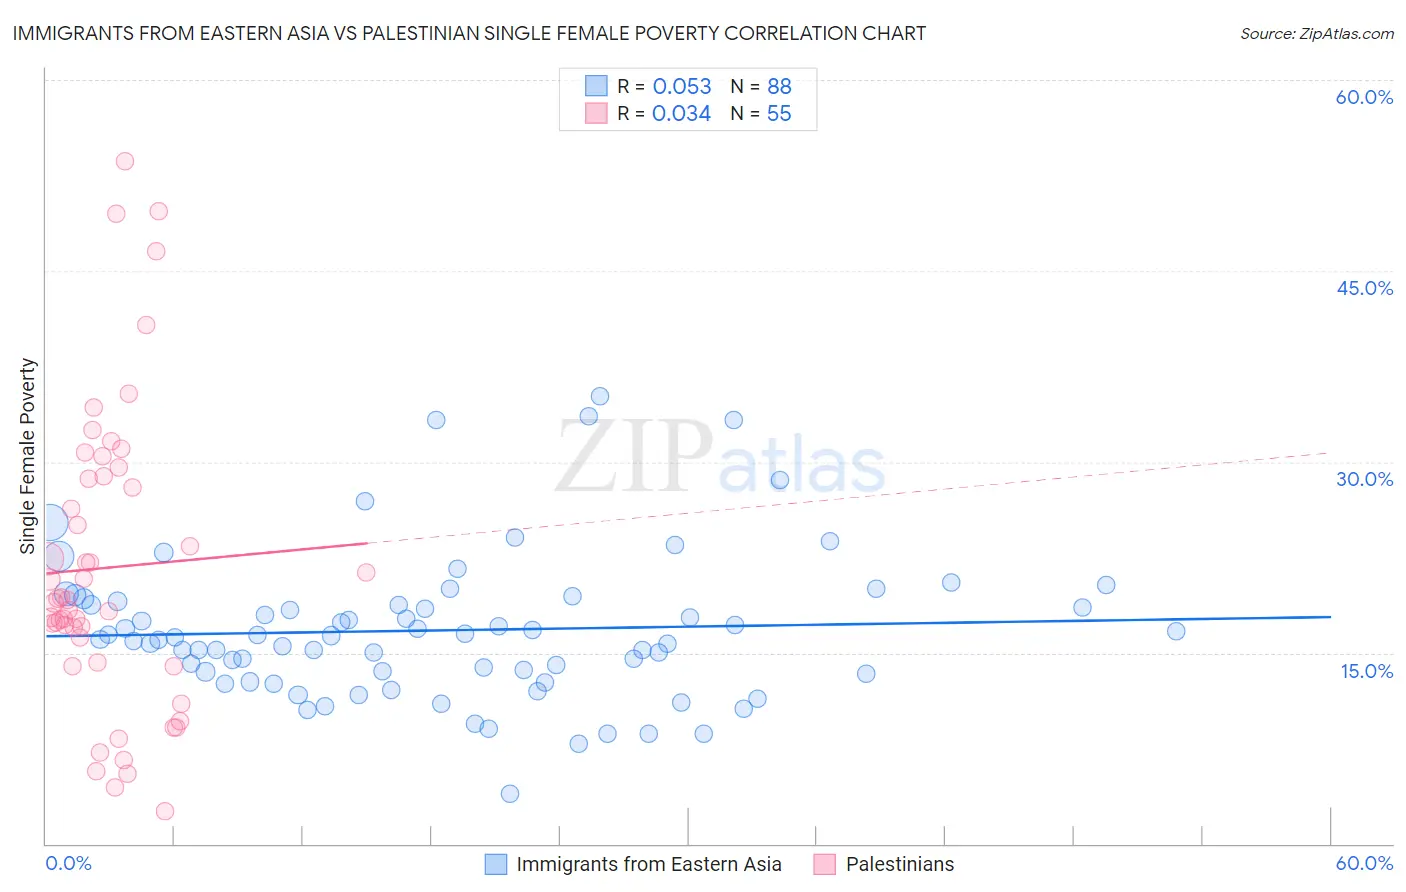
Immigrants from Eastern Asia vs Palestinian Single Female Poverty Correlation Chart
The statistical analysis conducted on geographies consisting of 487,543,414 people shows a slight positive correlation between the proportion of Immigrants from Eastern Asia and poverty level among single females in the United States with a correlation coefficient (R) of 0.053 and weighted average of 18.1%. Similarly, the statistical analysis conducted on geographies consisting of 214,894,692 people shows no correlation between the proportion of Palestinians and poverty level among single females in the United States with a correlation coefficient (R) of 0.034 and weighted average of 19.2%, a difference of 6.1%.
Single Female Poverty Correlation Summary
| Measurement | Immigrants from Eastern Asia | Palestinian |
| Minimum | 3.9% | 2.6% |
| Maximum | 35.1% | 53.6% |
| Range | 31.2% | 51.0% |
| Mean | 16.8% | 21.7% |
| Median | 16.1% | 19.1% |
| Interquartile 25% (IQ1) | 13.4% | 14.2% |
| Interquartile 75% (IQ3) | 18.9% | 28.9% |
| Interquartile Range (IQR) | 5.5% | 14.7% |
| Standard Deviation (Sample) | 5.7% | 11.7% |
| Standard Deviation (Population) | 5.7% | 11.6% |
Similar Demographics by Single Female Poverty
Demographics Similar to Immigrants from Eastern Asia by Single Female Poverty
In terms of single female poverty, the demographic groups most similar to Immigrants from Eastern Asia are Immigrants from China (18.1%, a difference of 0.030%), Immigrants from Korea (18.1%, a difference of 0.28%), Immigrants from Greece (18.3%, a difference of 0.71%), Maltese (18.3%, a difference of 0.77%), and Burmese (18.3%, a difference of 0.78%).
| Demographics | Rating | Rank | Single Female Poverty |
| Immigrants | Lithuania | 100.0 /100 | #11 | Exceptional 17.8% |
| Immigrants | South Central Asia | 100.0 /100 | #12 | Exceptional 17.8% |
| Immigrants | Bolivia | 100.0 /100 | #13 | Exceptional 17.8% |
| Bolivians | 100.0 /100 | #14 | Exceptional 17.9% |
| Indians (Asian) | 100.0 /100 | #15 | Exceptional 17.9% |
| Iranians | 100.0 /100 | #16 | Exceptional 18.0% |
| Immigrants | Korea | 100.0 /100 | #17 | Exceptional 18.1% |
| Immigrants | Eastern Asia | 100.0 /100 | #18 | Exceptional 18.1% |
| Immigrants | China | 100.0 /100 | #19 | Exceptional 18.1% |
| Immigrants | Greece | 100.0 /100 | #20 | Exceptional 18.3% |
| Maltese | 100.0 /100 | #21 | Exceptional 18.3% |
| Burmese | 100.0 /100 | #22 | Exceptional 18.3% |
| Asians | 100.0 /100 | #23 | Exceptional 18.3% |
| Armenians | 100.0 /100 | #24 | Exceptional 18.3% |
| Immigrants | Singapore | 100.0 /100 | #25 | Exceptional 18.3% |
Demographics Similar to Palestinians by Single Female Poverty
In terms of single female poverty, the demographic groups most similar to Palestinians are Cypriot (19.2%, a difference of 0.020%), Immigrants from Europe (19.2%, a difference of 0.040%), Immigrants from Egypt (19.2%, a difference of 0.040%), Immigrants from Northern Europe (19.2%, a difference of 0.050%), and Laotian (19.3%, a difference of 0.080%).
| Demographics | Rating | Rank | Single Female Poverty |
| Sri Lankans | 99.6 /100 | #59 | Exceptional 19.2% |
| Russians | 99.6 /100 | #60 | Exceptional 19.2% |
| Cambodians | 99.6 /100 | #61 | Exceptional 19.2% |
| Lithuanians | 99.6 /100 | #62 | Exceptional 19.2% |
| Immigrants | Northern Europe | 99.6 /100 | #63 | Exceptional 19.2% |
| Immigrants | Europe | 99.6 /100 | #64 | Exceptional 19.2% |
| Cypriots | 99.6 /100 | #65 | Exceptional 19.2% |
| Palestinians | 99.6 /100 | #66 | Exceptional 19.2% |
| Immigrants | Egypt | 99.6 /100 | #67 | Exceptional 19.2% |
| Laotians | 99.5 /100 | #68 | Exceptional 19.3% |
| Paraguayans | 99.5 /100 | #69 | Exceptional 19.3% |
| Immigrants | Jordan | 99.4 /100 | #70 | Exceptional 19.3% |
| Immigrants | South Eastern Asia | 99.4 /100 | #71 | Exceptional 19.3% |
| Immigrants | Latvia | 99.4 /100 | #72 | Exceptional 19.3% |
| Immigrants | Peru | 99.4 /100 | #73 | Exceptional 19.3% |