Immigrants vs Palestinian Single Female Poverty
COMPARE
Immigrants
Palestinian
Single Female Poverty
Single Female Poverty Comparison
Immigrants
Palestinians
21.4%
SINGLE FEMALE POVERTY
22.0/ 100
METRIC RATING
199th/ 347
METRIC RANK
19.2%
SINGLE FEMALE POVERTY
99.6/ 100
METRIC RATING
66th/ 347
METRIC RANK
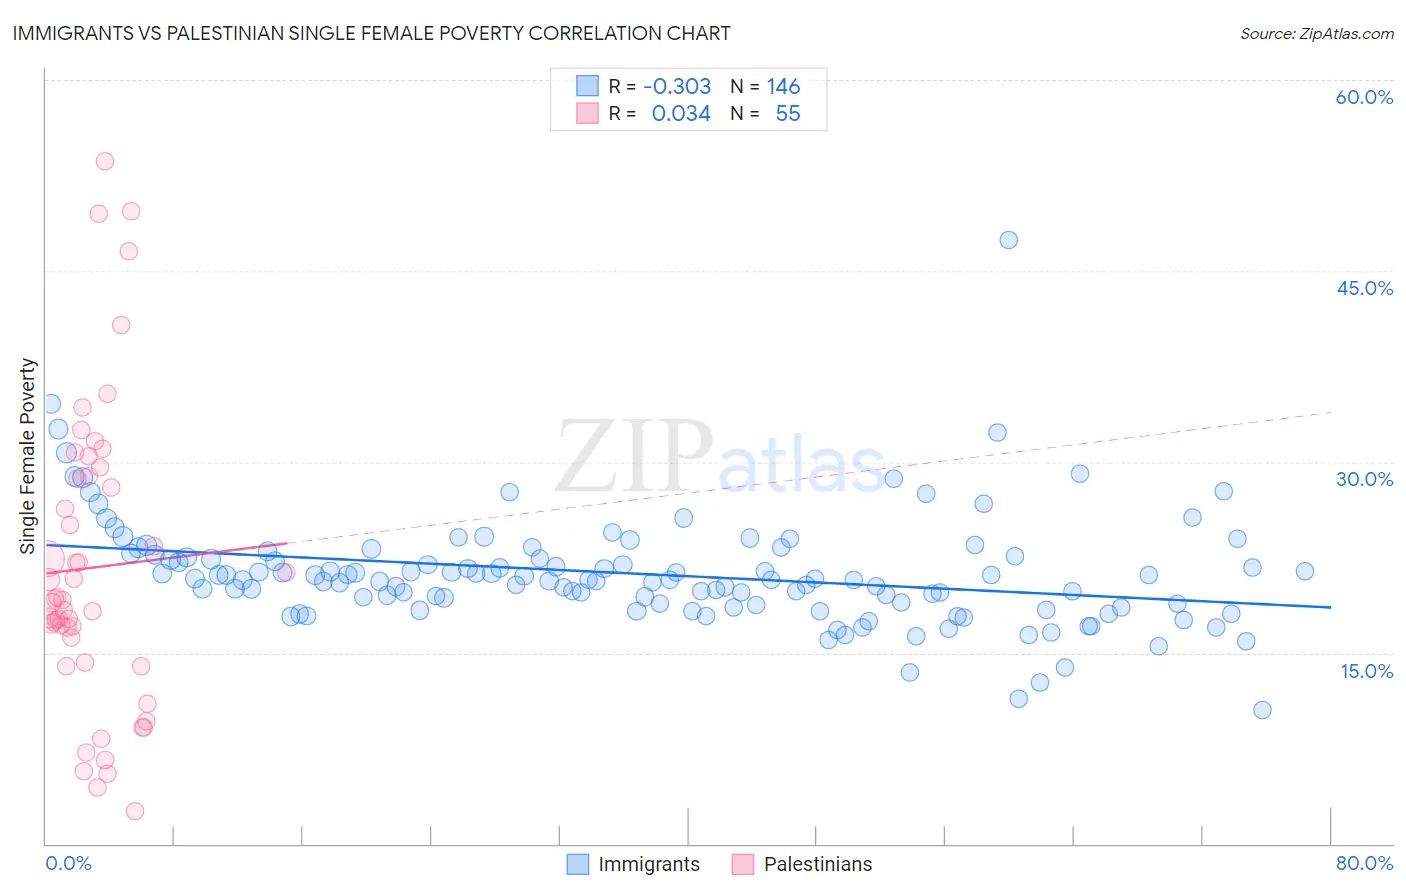
Immigrants vs Palestinian Single Female Poverty Correlation Chart
The statistical analysis conducted on geographies consisting of 556,808,964 people shows a mild negative correlation between the proportion of Immigrants and poverty level among single females in the United States with a correlation coefficient (R) of -0.303 and weighted average of 21.4%. Similarly, the statistical analysis conducted on geographies consisting of 214,894,692 people shows no correlation between the proportion of Palestinians and poverty level among single females in the United States with a correlation coefficient (R) of 0.034 and weighted average of 19.2%, a difference of 11.4%.
Single Female Poverty Correlation Summary
| Measurement | Immigrants | Palestinian |
| Minimum | 10.5% | 2.6% |
| Maximum | 47.5% | 53.6% |
| Range | 36.9% | 51.0% |
| Mean | 21.2% | 21.7% |
| Median | 20.7% | 19.1% |
| Interquartile 25% (IQ1) | 18.9% | 14.2% |
| Interquartile 75% (IQ3) | 22.6% | 28.9% |
| Interquartile Range (IQR) | 3.8% | 14.7% |
| Standard Deviation (Sample) | 4.4% | 11.7% |
| Standard Deviation (Population) | 4.4% | 11.6% |
Similar Demographics by Single Female Poverty
Demographics Similar to Immigrants by Single Female Poverty
In terms of single female poverty, the demographic groups most similar to Immigrants are Irish (21.4%, a difference of 0.050%), Nigerian (21.4%, a difference of 0.10%), Immigrants from Kenya (21.4%, a difference of 0.12%), Swiss (21.4%, a difference of 0.19%), and Immigrants from Haiti (21.5%, a difference of 0.30%).
| Demographics | Rating | Rank | Single Female Poverty |
| Immigrants | Jamaica | 30.5 /100 | #192 | Fair 21.3% |
| Basques | 28.1 /100 | #193 | Fair 21.3% |
| Czechoslovakians | 27.7 /100 | #194 | Fair 21.3% |
| Nicaraguans | 27.6 /100 | #195 | Fair 21.3% |
| Immigrants | Saudi Arabia | 27.1 /100 | #196 | Fair 21.3% |
| Japanese | 26.4 /100 | #197 | Fair 21.3% |
| Swiss | 24.2 /100 | #198 | Fair 21.4% |
| Immigrants | Immigrants | 22.0 /100 | #199 | Fair 21.4% |
| Irish | 21.4 /100 | #200 | Fair 21.4% |
| Nigerians | 20.9 /100 | #201 | Fair 21.4% |
| Immigrants | Kenya | 20.7 /100 | #202 | Fair 21.4% |
| Immigrants | Haiti | 18.8 /100 | #203 | Poor 21.5% |
| Immigrants | Africa | 16.7 /100 | #204 | Poor 21.5% |
| Finns | 16.2 /100 | #205 | Poor 21.5% |
| Belgians | 16.1 /100 | #206 | Poor 21.5% |
Demographics Similar to Palestinians by Single Female Poverty
In terms of single female poverty, the demographic groups most similar to Palestinians are Cypriot (19.2%, a difference of 0.020%), Immigrants from Europe (19.2%, a difference of 0.040%), Immigrants from Egypt (19.2%, a difference of 0.040%), Immigrants from Northern Europe (19.2%, a difference of 0.050%), and Laotian (19.3%, a difference of 0.080%).
| Demographics | Rating | Rank | Single Female Poverty |
| Sri Lankans | 99.6 /100 | #59 | Exceptional 19.2% |
| Russians | 99.6 /100 | #60 | Exceptional 19.2% |
| Cambodians | 99.6 /100 | #61 | Exceptional 19.2% |
| Lithuanians | 99.6 /100 | #62 | Exceptional 19.2% |
| Immigrants | Northern Europe | 99.6 /100 | #63 | Exceptional 19.2% |
| Immigrants | Europe | 99.6 /100 | #64 | Exceptional 19.2% |
| Cypriots | 99.6 /100 | #65 | Exceptional 19.2% |
| Palestinians | 99.6 /100 | #66 | Exceptional 19.2% |
| Immigrants | Egypt | 99.6 /100 | #67 | Exceptional 19.2% |
| Laotians | 99.5 /100 | #68 | Exceptional 19.3% |
| Paraguayans | 99.5 /100 | #69 | Exceptional 19.3% |
| Immigrants | Jordan | 99.4 /100 | #70 | Exceptional 19.3% |
| Immigrants | South Eastern Asia | 99.4 /100 | #71 | Exceptional 19.3% |
| Immigrants | Latvia | 99.4 /100 | #72 | Exceptional 19.3% |
| Immigrants | Peru | 99.4 /100 | #73 | Exceptional 19.3% |