Celtic vs Cree Single Female Poverty
COMPARE
Celtic
Cree
Single Female Poverty
Single Female Poverty Comparison
Celtics
Cree
22.7%
SINGLE FEMALE POVERTY
0.5/ 100
METRIC RATING
260th/ 347
METRIC RANK
24.1%
SINGLE FEMALE POVERTY
0.0/ 100
METRIC RATING
286th/ 347
METRIC RANK
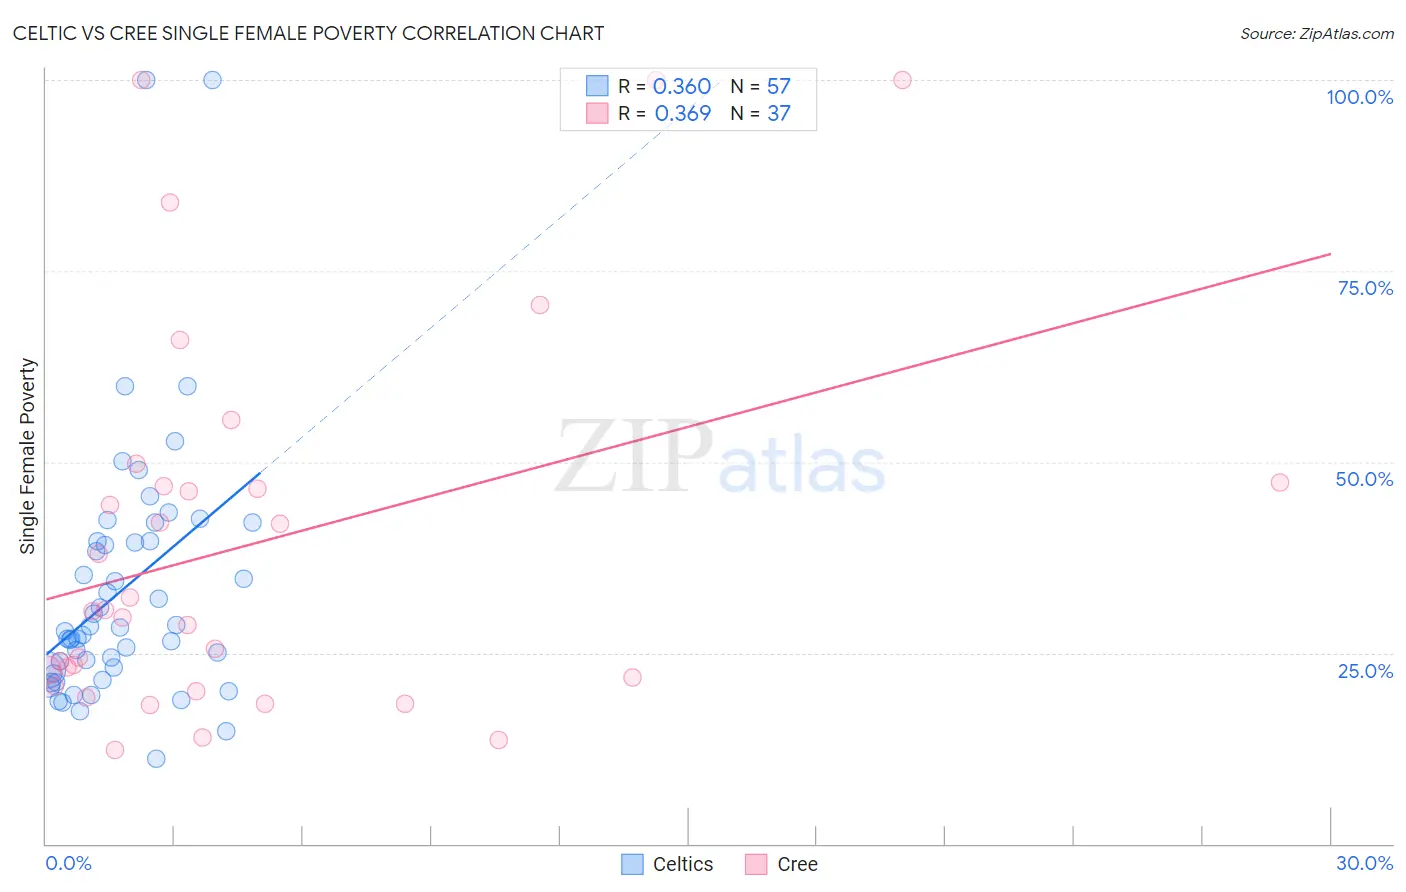
Celtic vs Cree Single Female Poverty Correlation Chart
The statistical analysis conducted on geographies consisting of 167,592,415 people shows a mild positive correlation between the proportion of Celtics and poverty level among single females in the United States with a correlation coefficient (R) of 0.360 and weighted average of 22.7%. Similarly, the statistical analysis conducted on geographies consisting of 75,960,780 people shows a mild positive correlation between the proportion of Cree and poverty level among single females in the United States with a correlation coefficient (R) of 0.369 and weighted average of 24.1%, a difference of 6.2%.
Single Female Poverty Correlation Summary
| Measurement | Celtic | Cree |
| Minimum | 11.1% | 12.2% |
| Maximum | 100.0% | 100.0% |
| Range | 88.9% | 87.8% |
| Mean | 33.1% | 39.2% |
| Median | 27.8% | 30.5% |
| Interquartile 25% (IQ1) | 22.5% | 21.2% |
| Interquartile 75% (IQ3) | 39.6% | 47.1% |
| Interquartile Range (IQR) | 17.1% | 25.9% |
| Standard Deviation (Sample) | 16.9% | 24.7% |
| Standard Deviation (Population) | 16.7% | 24.4% |
Similar Demographics by Single Female Poverty
Demographics Similar to Celtics by Single Female Poverty
In terms of single female poverty, the demographic groups most similar to Celtics are White/Caucasian (22.7%, a difference of 0.080%), Bahamian (22.7%, a difference of 0.21%), Immigrants from Cabo Verde (22.8%, a difference of 0.27%), Sudanese (22.6%, a difference of 0.41%), and British West Indian (22.8%, a difference of 0.52%).
| Demographics | Rating | Rank | Single Female Poverty |
| Immigrants | Liberia | 0.9 /100 | #253 | Tragic 22.5% |
| Immigrants | Burma/Myanmar | 0.8 /100 | #254 | Tragic 22.6% |
| Immigrants | Sudan | 0.8 /100 | #255 | Tragic 22.6% |
| Immigrants | Belize | 0.8 /100 | #256 | Tragic 22.6% |
| Sudanese | 0.7 /100 | #257 | Tragic 22.6% |
| Bahamians | 0.6 /100 | #258 | Tragic 22.7% |
| Whites/Caucasians | 0.6 /100 | #259 | Tragic 22.7% |
| Celtics | 0.5 /100 | #260 | Tragic 22.7% |
| Immigrants | Cabo Verde | 0.4 /100 | #261 | Tragic 22.8% |
| British West Indians | 0.4 /100 | #262 | Tragic 22.8% |
| Scotch-Irish | 0.3 /100 | #263 | Tragic 22.9% |
| Immigrants | Laos | 0.3 /100 | #264 | Tragic 22.9% |
| Central Americans | 0.2 /100 | #265 | Tragic 23.0% |
| Immigrants | Micronesia | 0.2 /100 | #266 | Tragic 23.0% |
| Senegalese | 0.2 /100 | #267 | Tragic 23.0% |
Demographics Similar to Cree by Single Female Poverty
In terms of single female poverty, the demographic groups most similar to Cree are Immigrants from Guatemala (24.1%, a difference of 0.040%), Bangladeshi (24.2%, a difference of 0.15%), Spanish American (24.2%, a difference of 0.17%), U.S. Virgin Islander (24.2%, a difference of 0.22%), and Indonesian (24.3%, a difference of 0.57%).
| Demographics | Rating | Rank | Single Female Poverty |
| Alaskan Athabascans | 0.0 /100 | #279 | Tragic 23.6% |
| Immigrants | Latin America | 0.0 /100 | #280 | Tragic 23.7% |
| Immigrants | Zaire | 0.0 /100 | #281 | Tragic 23.8% |
| Guatemalans | 0.0 /100 | #282 | Tragic 23.8% |
| German Russians | 0.0 /100 | #283 | Tragic 23.9% |
| Immigrants | Dominica | 0.0 /100 | #284 | Tragic 23.9% |
| Immigrants | Guatemala | 0.0 /100 | #285 | Tragic 24.1% |
| Cree | 0.0 /100 | #286 | Tragic 24.1% |
| Bangladeshis | 0.0 /100 | #287 | Tragic 24.2% |
| Spanish Americans | 0.0 /100 | #288 | Tragic 24.2% |
| U.S. Virgin Islanders | 0.0 /100 | #289 | Tragic 24.2% |
| Indonesians | 0.0 /100 | #290 | Tragic 24.3% |
| Osage | 0.0 /100 | #291 | Tragic 24.4% |
| Alsatians | 0.0 /100 | #292 | Tragic 24.5% |
| Americans | 0.0 /100 | #293 | Tragic 24.5% |