Celtic vs Immigrants from Norway Single Female Poverty
COMPARE
Celtic
Immigrants from Norway
Single Female Poverty
Single Female Poverty Comparison
Celtics
Immigrants from Norway
22.7%
SINGLE FEMALE POVERTY
0.5/ 100
METRIC RATING
260th/ 347
METRIC RANK
20.8%
SINGLE FEMALE POVERTY
63.0/ 100
METRIC RATING
167th/ 347
METRIC RANK
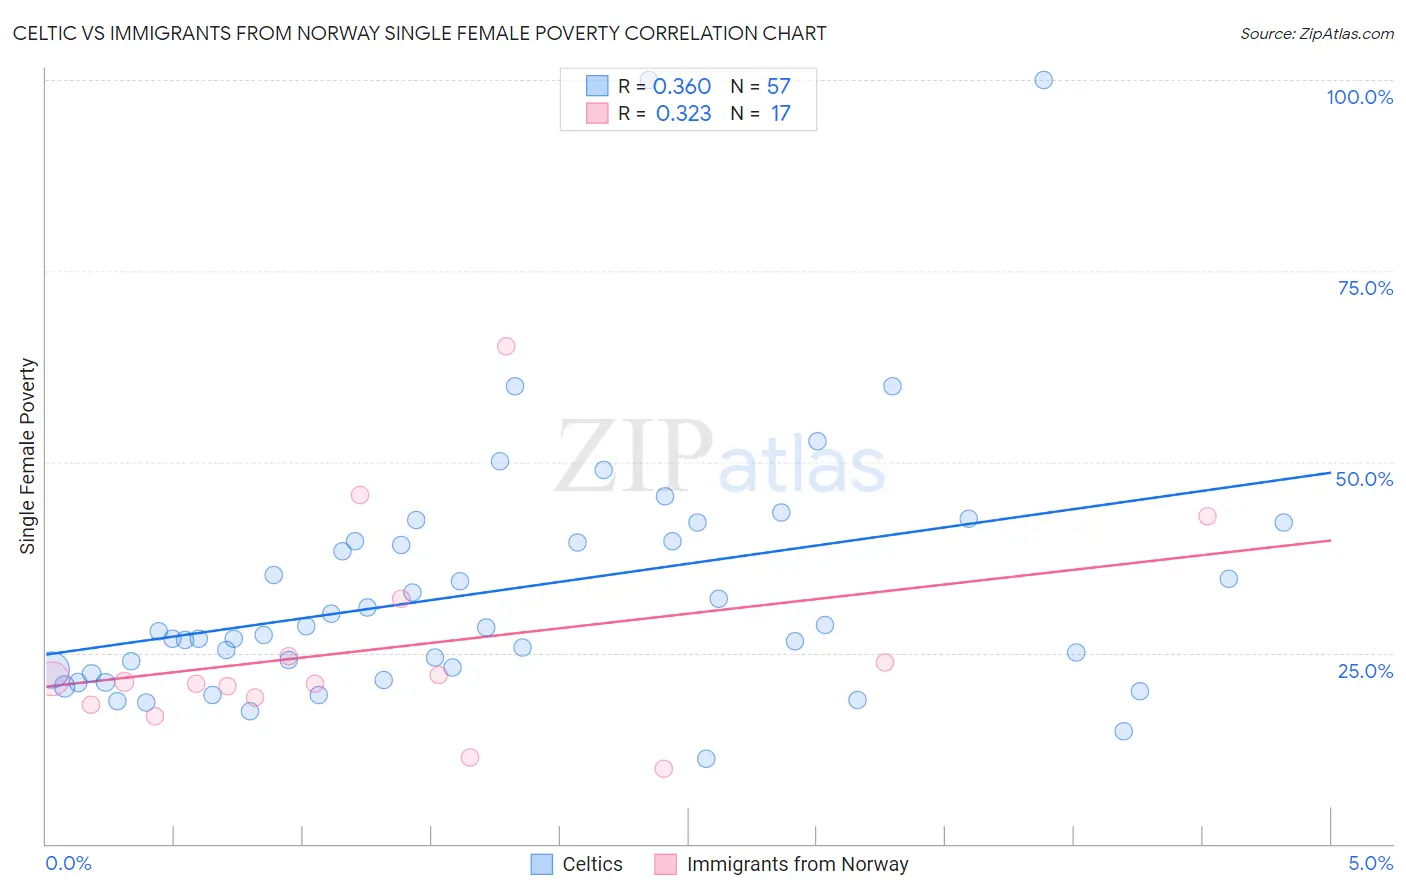
Celtic vs Immigrants from Norway Single Female Poverty Correlation Chart
The statistical analysis conducted on geographies consisting of 167,592,415 people shows a mild positive correlation between the proportion of Celtics and poverty level among single females in the United States with a correlation coefficient (R) of 0.360 and weighted average of 22.7%. Similarly, the statistical analysis conducted on geographies consisting of 115,651,083 people shows a mild positive correlation between the proportion of Immigrants from Norway and poverty level among single females in the United States with a correlation coefficient (R) of 0.323 and weighted average of 20.8%, a difference of 9.1%.
Single Female Poverty Correlation Summary
| Measurement | Celtic | Immigrants from Norway |
| Minimum | 11.1% | 9.8% |
| Maximum | 100.0% | 65.2% |
| Range | 88.9% | 55.4% |
| Mean | 33.1% | 25.7% |
| Median | 27.8% | 21.2% |
| Interquartile 25% (IQ1) | 22.5% | 18.7% |
| Interquartile 75% (IQ3) | 39.6% | 28.3% |
| Interquartile Range (IQR) | 17.1% | 9.6% |
| Standard Deviation (Sample) | 16.9% | 13.8% |
| Standard Deviation (Population) | 16.7% | 13.4% |
Similar Demographics by Single Female Poverty
Demographics Similar to Celtics by Single Female Poverty
In terms of single female poverty, the demographic groups most similar to Celtics are White/Caucasian (22.7%, a difference of 0.080%), Bahamian (22.7%, a difference of 0.21%), Immigrants from Cabo Verde (22.8%, a difference of 0.27%), Sudanese (22.6%, a difference of 0.41%), and British West Indian (22.8%, a difference of 0.52%).
| Demographics | Rating | Rank | Single Female Poverty |
| Immigrants | Liberia | 0.9 /100 | #253 | Tragic 22.5% |
| Immigrants | Burma/Myanmar | 0.8 /100 | #254 | Tragic 22.6% |
| Immigrants | Sudan | 0.8 /100 | #255 | Tragic 22.6% |
| Immigrants | Belize | 0.8 /100 | #256 | Tragic 22.6% |
| Sudanese | 0.7 /100 | #257 | Tragic 22.6% |
| Bahamians | 0.6 /100 | #258 | Tragic 22.7% |
| Whites/Caucasians | 0.6 /100 | #259 | Tragic 22.7% |
| Celtics | 0.5 /100 | #260 | Tragic 22.7% |
| Immigrants | Cabo Verde | 0.4 /100 | #261 | Tragic 22.8% |
| British West Indians | 0.4 /100 | #262 | Tragic 22.8% |
| Scotch-Irish | 0.3 /100 | #263 | Tragic 22.9% |
| Immigrants | Laos | 0.3 /100 | #264 | Tragic 22.9% |
| Central Americans | 0.2 /100 | #265 | Tragic 23.0% |
| Immigrants | Micronesia | 0.2 /100 | #266 | Tragic 23.0% |
| Senegalese | 0.2 /100 | #267 | Tragic 23.0% |
Demographics Similar to Immigrants from Norway by Single Female Poverty
In terms of single female poverty, the demographic groups most similar to Immigrants from Norway are Norwegian (20.8%, a difference of 0.0%), Ugandan (20.8%, a difference of 0.070%), Immigrants from Costa Rica (20.9%, a difference of 0.090%), Iraqi (20.8%, a difference of 0.10%), and Lebanese (20.8%, a difference of 0.32%).
| Demographics | Rating | Rank | Single Female Poverty |
| Arabs | 70.8 /100 | #160 | Good 20.7% |
| Kenyans | 68.5 /100 | #161 | Good 20.8% |
| Northern Europeans | 68.4 /100 | #162 | Good 20.8% |
| Lebanese | 67.6 /100 | #163 | Good 20.8% |
| Iraqis | 64.5 /100 | #164 | Good 20.8% |
| Ugandans | 64.0 /100 | #165 | Good 20.8% |
| Norwegians | 63.0 /100 | #166 | Good 20.8% |
| Immigrants | Norway | 63.0 /100 | #167 | Good 20.8% |
| Immigrants | Costa Rica | 61.5 /100 | #168 | Good 20.9% |
| Immigrants | Trinidad and Tobago | 56.3 /100 | #169 | Average 20.9% |
| New Zealanders | 53.2 /100 | #170 | Average 21.0% |
| Moroccans | 52.8 /100 | #171 | Average 21.0% |
| Guyanese | 52.0 /100 | #172 | Average 21.0% |
| Immigrants | Guyana | 50.6 /100 | #173 | Average 21.0% |
| Cubans | 50.0 /100 | #174 | Average 21.0% |