Alsatian vs Palestinian Single Female Poverty
COMPARE
Alsatian
Palestinian
Single Female Poverty
Single Female Poverty Comparison
Alsatians
Palestinians
24.5%
SINGLE FEMALE POVERTY
0.0/ 100
METRIC RATING
292nd/ 347
METRIC RANK
19.2%
SINGLE FEMALE POVERTY
99.6/ 100
METRIC RATING
66th/ 347
METRIC RANK
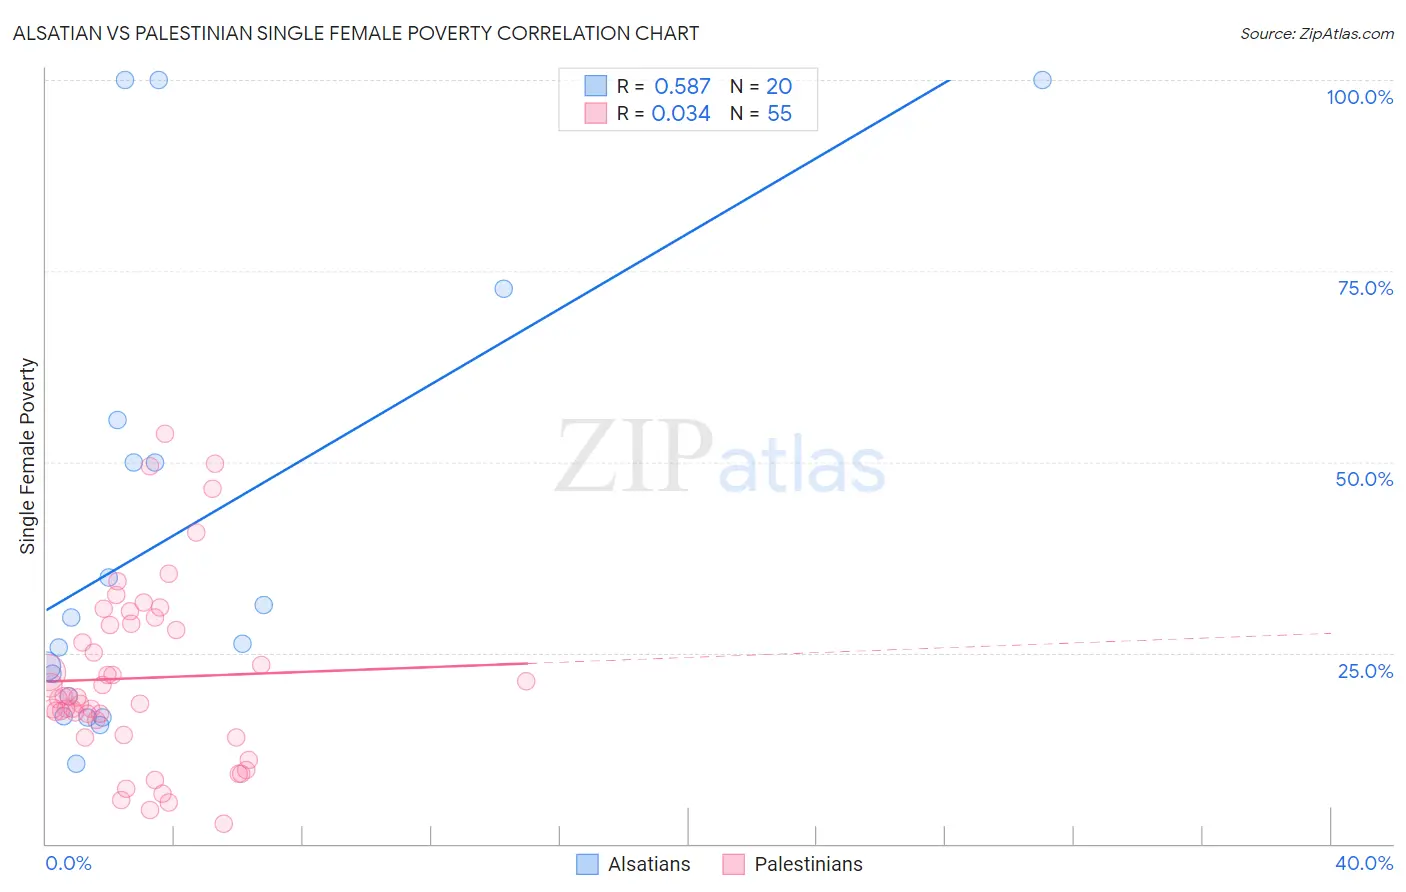
Alsatian vs Palestinian Single Female Poverty Correlation Chart
The statistical analysis conducted on geographies consisting of 82,305,024 people shows a substantial positive correlation between the proportion of Alsatians and poverty level among single females in the United States with a correlation coefficient (R) of 0.587 and weighted average of 24.5%. Similarly, the statistical analysis conducted on geographies consisting of 214,894,692 people shows no correlation between the proportion of Palestinians and poverty level among single females in the United States with a correlation coefficient (R) of 0.034 and weighted average of 19.2%, a difference of 27.4%.
Single Female Poverty Correlation Summary
| Measurement | Alsatian | Palestinian |
| Minimum | 10.5% | 2.6% |
| Maximum | 100.0% | 53.6% |
| Range | 89.5% | 51.0% |
| Mean | 40.8% | 21.7% |
| Median | 27.9% | 19.1% |
| Interquartile 25% (IQ1) | 18.1% | 14.2% |
| Interquartile 75% (IQ3) | 52.7% | 28.9% |
| Interquartile Range (IQR) | 34.6% | 14.7% |
| Standard Deviation (Sample) | 30.0% | 11.7% |
| Standard Deviation (Population) | 29.2% | 11.6% |
Similar Demographics by Single Female Poverty
Demographics Similar to Alsatians by Single Female Poverty
In terms of single female poverty, the demographic groups most similar to Alsatians are American (24.5%, a difference of 0.080%), French American Indian (24.6%, a difference of 0.23%), Osage (24.4%, a difference of 0.37%), Hispanic or Latino (24.6%, a difference of 0.57%), and Indonesian (24.3%, a difference of 0.97%).
| Demographics | Rating | Rank | Single Female Poverty |
| Immigrants | Guatemala | 0.0 /100 | #285 | Tragic 24.1% |
| Cree | 0.0 /100 | #286 | Tragic 24.1% |
| Bangladeshis | 0.0 /100 | #287 | Tragic 24.2% |
| Spanish Americans | 0.0 /100 | #288 | Tragic 24.2% |
| U.S. Virgin Islanders | 0.0 /100 | #289 | Tragic 24.2% |
| Indonesians | 0.0 /100 | #290 | Tragic 24.3% |
| Osage | 0.0 /100 | #291 | Tragic 24.4% |
| Alsatians | 0.0 /100 | #292 | Tragic 24.5% |
| Americans | 0.0 /100 | #293 | Tragic 24.5% |
| French American Indians | 0.0 /100 | #294 | Tragic 24.6% |
| Hispanics or Latinos | 0.0 /100 | #295 | Tragic 24.6% |
| Africans | 0.0 /100 | #296 | Tragic 24.8% |
| Immigrants | Central America | 0.0 /100 | #297 | Tragic 24.8% |
| Yaqui | 0.0 /100 | #298 | Tragic 24.9% |
| Mexicans | 0.0 /100 | #299 | Tragic 25.0% |
Demographics Similar to Palestinians by Single Female Poverty
In terms of single female poverty, the demographic groups most similar to Palestinians are Cypriot (19.2%, a difference of 0.020%), Immigrants from Europe (19.2%, a difference of 0.040%), Immigrants from Egypt (19.2%, a difference of 0.040%), Immigrants from Northern Europe (19.2%, a difference of 0.050%), and Laotian (19.3%, a difference of 0.080%).
| Demographics | Rating | Rank | Single Female Poverty |
| Sri Lankans | 99.6 /100 | #59 | Exceptional 19.2% |
| Russians | 99.6 /100 | #60 | Exceptional 19.2% |
| Cambodians | 99.6 /100 | #61 | Exceptional 19.2% |
| Lithuanians | 99.6 /100 | #62 | Exceptional 19.2% |
| Immigrants | Northern Europe | 99.6 /100 | #63 | Exceptional 19.2% |
| Immigrants | Europe | 99.6 /100 | #64 | Exceptional 19.2% |
| Cypriots | 99.6 /100 | #65 | Exceptional 19.2% |
| Palestinians | 99.6 /100 | #66 | Exceptional 19.2% |
| Immigrants | Egypt | 99.6 /100 | #67 | Exceptional 19.2% |
| Laotians | 99.5 /100 | #68 | Exceptional 19.3% |
| Paraguayans | 99.5 /100 | #69 | Exceptional 19.3% |
| Immigrants | Jordan | 99.4 /100 | #70 | Exceptional 19.3% |
| Immigrants | South Eastern Asia | 99.4 /100 | #71 | Exceptional 19.3% |
| Immigrants | Latvia | 99.4 /100 | #72 | Exceptional 19.3% |
| Immigrants | Peru | 99.4 /100 | #73 | Exceptional 19.3% |