Taiwanese vs Palestinian Single Female Poverty
COMPARE
Taiwanese
Palestinian
Single Female Poverty
Single Female Poverty Comparison
Taiwanese
Palestinians
19.4%
SINGLE FEMALE POVERTY
99.2/ 100
METRIC RATING
83rd/ 347
METRIC RANK
19.2%
SINGLE FEMALE POVERTY
99.6/ 100
METRIC RATING
66th/ 347
METRIC RANK
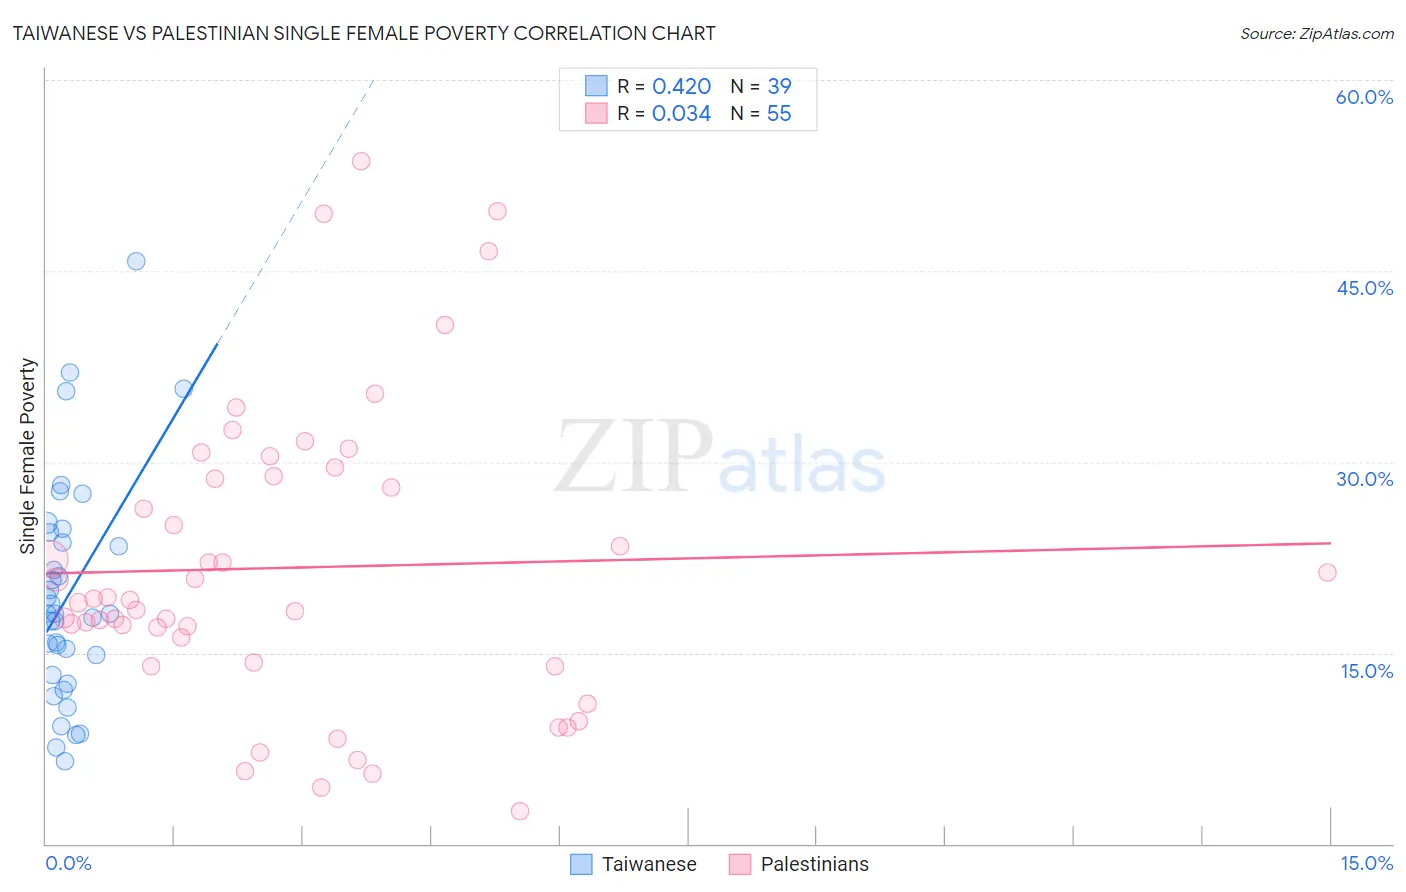
Taiwanese vs Palestinian Single Female Poverty Correlation Chart
The statistical analysis conducted on geographies consisting of 31,618,810 people shows a moderate positive correlation between the proportion of Taiwanese and poverty level among single females in the United States with a correlation coefficient (R) of 0.420 and weighted average of 19.4%. Similarly, the statistical analysis conducted on geographies consisting of 214,894,692 people shows no correlation between the proportion of Palestinians and poverty level among single females in the United States with a correlation coefficient (R) of 0.034 and weighted average of 19.2%, a difference of 0.96%.
Single Female Poverty Correlation Summary
| Measurement | Taiwanese | Palestinian |
| Minimum | 6.5% | 2.6% |
| Maximum | 45.7% | 53.6% |
| Range | 39.3% | 51.0% |
| Mean | 19.6% | 21.7% |
| Median | 18.1% | 19.1% |
| Interquartile 25% (IQ1) | 13.2% | 14.2% |
| Interquartile 75% (IQ3) | 24.5% | 28.9% |
| Interquartile Range (IQR) | 11.2% | 14.7% |
| Standard Deviation (Sample) | 8.7% | 11.7% |
| Standard Deviation (Population) | 8.6% | 11.6% |
Demographics Similar to Taiwanese and Palestinians by Single Female Poverty
In terms of single female poverty, the demographic groups most similar to Taiwanese are Immigrants from Malaysia (19.4%, a difference of 0.010%), Immigrants from Scotland (19.4%, a difference of 0.020%), Immigrants from Australia (19.4%, a difference of 0.050%), Immigrants from Sierra Leone (19.4%, a difference of 0.080%), and Immigrants from Sweden (19.4%, a difference of 0.080%). Similarly, the demographic groups most similar to Palestinians are Cypriot (19.2%, a difference of 0.020%), Immigrants from Europe (19.2%, a difference of 0.040%), Immigrants from Egypt (19.2%, a difference of 0.040%), Laotian (19.3%, a difference of 0.080%), and Paraguayan (19.3%, a difference of 0.33%).
| Demographics | Rating | Rank | Single Female Poverty |
| Immigrants | Europe | 99.6 /100 | #64 | Exceptional 19.2% |
| Cypriots | 99.6 /100 | #65 | Exceptional 19.2% |
| Palestinians | 99.6 /100 | #66 | Exceptional 19.2% |
| Immigrants | Egypt | 99.6 /100 | #67 | Exceptional 19.2% |
| Laotians | 99.5 /100 | #68 | Exceptional 19.3% |
| Paraguayans | 99.5 /100 | #69 | Exceptional 19.3% |
| Immigrants | Jordan | 99.4 /100 | #70 | Exceptional 19.3% |
| Immigrants | South Eastern Asia | 99.4 /100 | #71 | Exceptional 19.3% |
| Immigrants | Latvia | 99.4 /100 | #72 | Exceptional 19.3% |
| Immigrants | Peru | 99.4 /100 | #73 | Exceptional 19.3% |
| Immigrants | Belarus | 99.4 /100 | #74 | Exceptional 19.3% |
| Immigrants | Turkey | 99.4 /100 | #75 | Exceptional 19.4% |
| Peruvians | 99.4 /100 | #76 | Exceptional 19.4% |
| Immigrants | Russia | 99.3 /100 | #77 | Exceptional 19.4% |
| Albanians | 99.3 /100 | #78 | Exceptional 19.4% |
| Immigrants | Sierra Leone | 99.3 /100 | #79 | Exceptional 19.4% |
| Immigrants | Australia | 99.3 /100 | #80 | Exceptional 19.4% |
| Immigrants | Scotland | 99.2 /100 | #81 | Exceptional 19.4% |
| Immigrants | Malaysia | 99.2 /100 | #82 | Exceptional 19.4% |
| Taiwanese | 99.2 /100 | #83 | Exceptional 19.4% |
| Immigrants | Sweden | 99.2 /100 | #84 | Exceptional 19.4% |