Immigrants from Latin America vs Immigrants from Congo Single Male Poverty
COMPARE
Immigrants from Latin America
Immigrants from Congo
Single Male Poverty
Single Male Poverty Comparison
Immigrants from Latin America
Immigrants from Congo
13.5%
SINGLE MALE POVERTY
1.3/ 100
METRIC RATING
245th/ 347
METRIC RANK
13.9%
SINGLE MALE POVERTY
0.2/ 100
METRIC RATING
265th/ 347
METRIC RANK
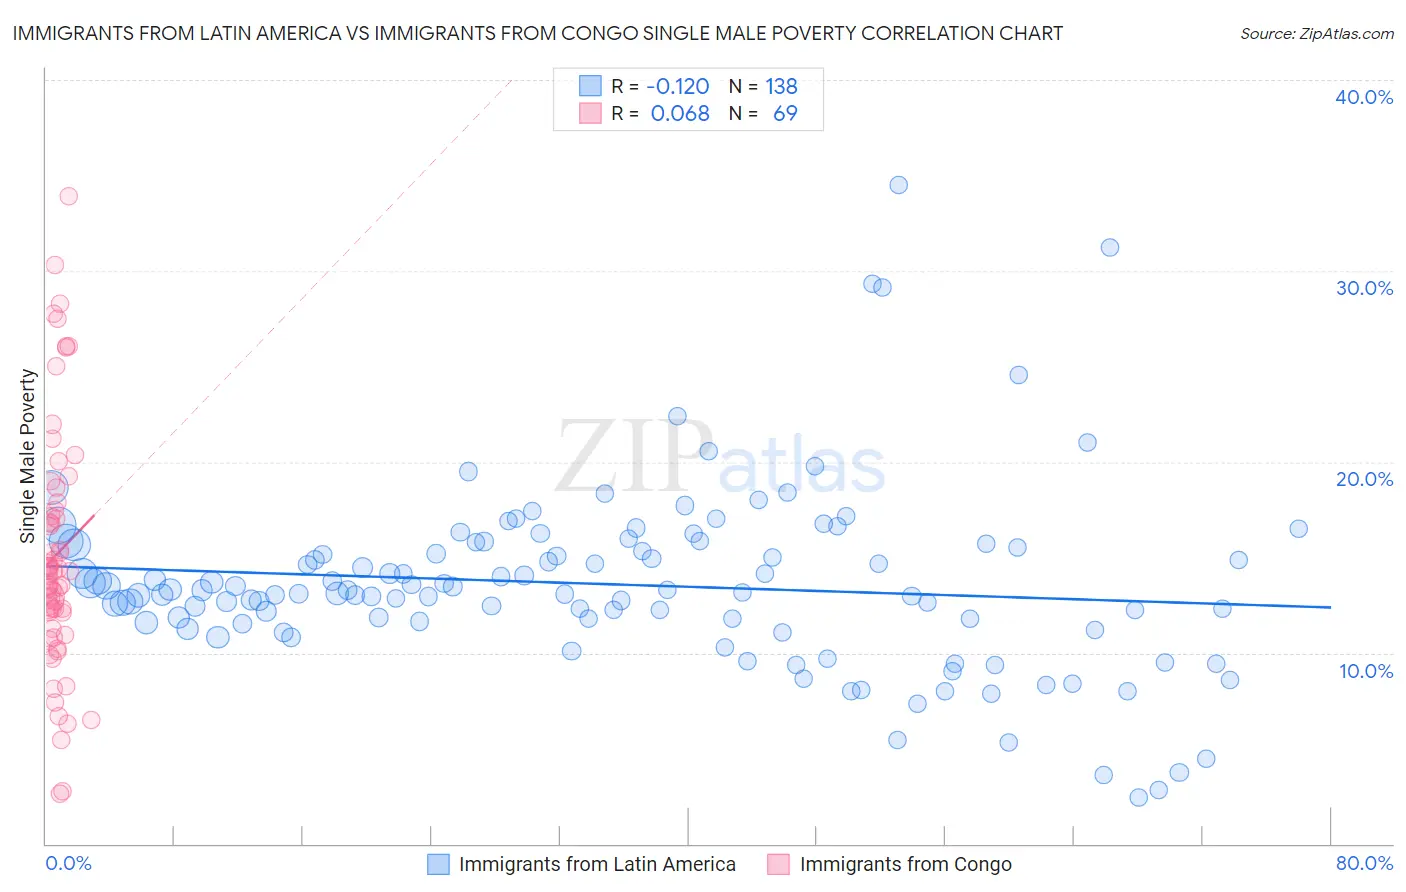
Immigrants from Latin America vs Immigrants from Congo Single Male Poverty Correlation Chart
The statistical analysis conducted on geographies consisting of 467,663,456 people shows a poor negative correlation between the proportion of Immigrants from Latin America and poverty level among single males in the United States with a correlation coefficient (R) of -0.120 and weighted average of 13.5%. Similarly, the statistical analysis conducted on geographies consisting of 89,882,140 people shows a slight positive correlation between the proportion of Immigrants from Congo and poverty level among single males in the United States with a correlation coefficient (R) of 0.068 and weighted average of 13.9%, a difference of 2.6%.
Single Male Poverty Correlation Summary
| Measurement | Immigrants from Latin America | Immigrants from Congo |
| Minimum | 2.4% | 2.6% |
| Maximum | 34.5% | 33.9% |
| Range | 32.0% | 31.2% |
| Mean | 13.6% | 15.1% |
| Median | 13.2% | 14.3% |
| Interquartile 25% (IQ1) | 11.6% | 11.7% |
| Interquartile 75% (IQ3) | 15.6% | 17.7% |
| Interquartile Range (IQR) | 4.1% | 6.0% |
| Standard Deviation (Sample) | 4.8% | 6.4% |
| Standard Deviation (Population) | 4.8% | 6.4% |
Demographics Similar to Immigrants from Latin America and Immigrants from Congo by Single Male Poverty
In terms of single male poverty, the demographic groups most similar to Immigrants from Latin America are Immigrants from Micronesia (13.5%, a difference of 0.10%), Belgian (13.5%, a difference of 0.12%), Czech (13.5%, a difference of 0.14%), Spanish (13.6%, a difference of 0.38%), and Immigrants from Somalia (13.6%, a difference of 0.40%). Similarly, the demographic groups most similar to Immigrants from Congo are West Indian (13.8%, a difference of 0.16%), Cape Verdean (13.8%, a difference of 0.35%), Fijian (13.8%, a difference of 0.47%), Hungarian (13.8%, a difference of 0.64%), and Swiss (13.8%, a difference of 0.69%).
| Demographics | Rating | Rank | Single Male Poverty |
| Immigrants | Latin America | 1.3 /100 | #245 | Tragic 13.5% |
| Immigrants | Micronesia | 1.2 /100 | #246 | Tragic 13.5% |
| Belgians | 1.2 /100 | #247 | Tragic 13.5% |
| Czechs | 1.2 /100 | #248 | Tragic 13.5% |
| Spanish | 1.0 /100 | #249 | Tragic 13.6% |
| Immigrants | Somalia | 1.0 /100 | #250 | Tragic 13.6% |
| Immigrants | Zaire | 0.9 /100 | #251 | Tragic 13.6% |
| Finns | 0.9 /100 | #252 | Tragic 13.6% |
| German Russians | 0.8 /100 | #253 | Tragic 13.6% |
| Sub-Saharan Africans | 0.5 /100 | #254 | Tragic 13.7% |
| Spaniards | 0.4 /100 | #255 | Tragic 13.7% |
| Immigrants | Belize | 0.4 /100 | #256 | Tragic 13.7% |
| Immigrants | Central America | 0.3 /100 | #257 | Tragic 13.8% |
| Immigrants | Guatemala | 0.3 /100 | #258 | Tragic 13.8% |
| Guatemalans | 0.3 /100 | #259 | Tragic 13.8% |
| Swiss | 0.3 /100 | #260 | Tragic 13.8% |
| Hungarians | 0.3 /100 | #261 | Tragic 13.8% |
| Fijians | 0.3 /100 | #262 | Tragic 13.8% |
| Cape Verdeans | 0.2 /100 | #263 | Tragic 13.8% |
| West Indians | 0.2 /100 | #264 | Tragic 13.8% |
| Immigrants | Congo | 0.2 /100 | #265 | Tragic 13.9% |