Chippewa vs Immigrants from Congo Single Male Poverty
COMPARE
Chippewa
Immigrants from Congo
Single Male Poverty
Single Male Poverty Comparison
Chippewa
Immigrants from Congo
16.4%
SINGLE MALE POVERTY
0.0/ 100
METRIC RATING
319th/ 347
METRIC RANK
13.9%
SINGLE MALE POVERTY
0.2/ 100
METRIC RATING
265th/ 347
METRIC RANK
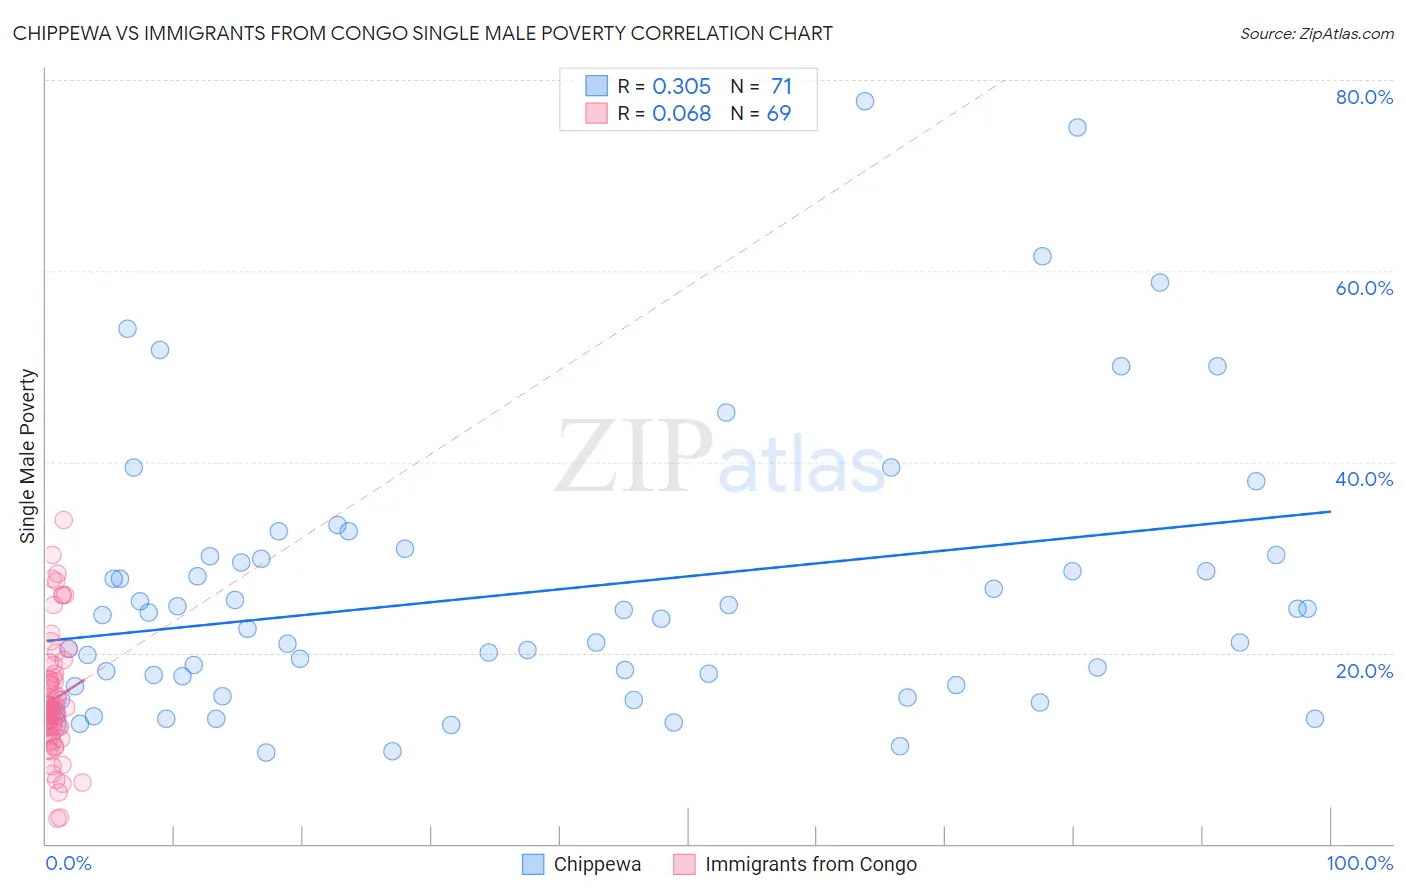
Chippewa vs Immigrants from Congo Single Male Poverty Correlation Chart
The statistical analysis conducted on geographies consisting of 198,626,002 people shows a mild positive correlation between the proportion of Chippewa and poverty level among single males in the United States with a correlation coefficient (R) of 0.305 and weighted average of 16.4%. Similarly, the statistical analysis conducted on geographies consisting of 89,882,140 people shows a slight positive correlation between the proportion of Immigrants from Congo and poverty level among single males in the United States with a correlation coefficient (R) of 0.068 and weighted average of 13.9%, a difference of 18.0%.
Single Male Poverty Correlation Summary
| Measurement | Chippewa | Immigrants from Congo |
| Minimum | 9.5% | 2.6% |
| Maximum | 77.8% | 33.9% |
| Range | 68.3% | 31.2% |
| Mean | 26.4% | 15.1% |
| Median | 23.6% | 14.3% |
| Interquartile 25% (IQ1) | 16.5% | 11.7% |
| Interquartile 75% (IQ3) | 30.2% | 17.7% |
| Interquartile Range (IQR) | 13.7% | 6.0% |
| Standard Deviation (Sample) | 14.6% | 6.4% |
| Standard Deviation (Population) | 14.5% | 6.4% |
Similar Demographics by Single Male Poverty
Demographics Similar to Chippewa by Single Male Poverty
In terms of single male poverty, the demographic groups most similar to Chippewa are Chickasaw (16.3%, a difference of 0.30%), Marshallese (16.4%, a difference of 0.48%), Osage (16.5%, a difference of 0.61%), Black/African American (16.2%, a difference of 1.1%), and Dutch West Indian (16.1%, a difference of 1.5%).
| Demographics | Rating | Rank | Single Male Poverty |
| Comanche | 0.0 /100 | #312 | Tragic 16.0% |
| Cherokee | 0.0 /100 | #313 | Tragic 16.1% |
| Alaskan Athabascans | 0.0 /100 | #314 | Tragic 16.1% |
| Cheyenne | 0.0 /100 | #315 | Tragic 16.1% |
| Dutch West Indians | 0.0 /100 | #316 | Tragic 16.1% |
| Blacks/African Americans | 0.0 /100 | #317 | Tragic 16.2% |
| Chickasaw | 0.0 /100 | #318 | Tragic 16.3% |
| Chippewa | 0.0 /100 | #319 | Tragic 16.4% |
| Marshallese | 0.0 /100 | #320 | Tragic 16.4% |
| Osage | 0.0 /100 | #321 | Tragic 16.5% |
| Shoshone | 0.0 /100 | #322 | Tragic 16.7% |
| Creek | 0.0 /100 | #323 | Tragic 16.8% |
| Immigrants | Yemen | 0.0 /100 | #324 | Tragic 16.9% |
| Choctaw | 0.0 /100 | #325 | Tragic 17.0% |
| Central American Indians | 0.0 /100 | #326 | Tragic 17.2% |
Demographics Similar to Immigrants from Congo by Single Male Poverty
In terms of single male poverty, the demographic groups most similar to Immigrants from Congo are West Indian (13.8%, a difference of 0.16%), Immigrants from Cabo Verde (13.9%, a difference of 0.31%), Cape Verdean (13.8%, a difference of 0.35%), Fijian (13.8%, a difference of 0.47%), and German (13.9%, a difference of 0.47%).
| Demographics | Rating | Rank | Single Male Poverty |
| Immigrants | Guatemala | 0.3 /100 | #258 | Tragic 13.8% |
| Guatemalans | 0.3 /100 | #259 | Tragic 13.8% |
| Swiss | 0.3 /100 | #260 | Tragic 13.8% |
| Hungarians | 0.3 /100 | #261 | Tragic 13.8% |
| Fijians | 0.3 /100 | #262 | Tragic 13.8% |
| Cape Verdeans | 0.2 /100 | #263 | Tragic 13.8% |
| West Indians | 0.2 /100 | #264 | Tragic 13.8% |
| Immigrants | Congo | 0.2 /100 | #265 | Tragic 13.9% |
| Immigrants | Cabo Verde | 0.1 /100 | #266 | Tragic 13.9% |
| Germans | 0.1 /100 | #267 | Tragic 13.9% |
| Immigrants | Mexico | 0.1 /100 | #268 | Tragic 13.9% |
| Scottish | 0.1 /100 | #269 | Tragic 14.0% |
| Immigrants | Saudi Arabia | 0.1 /100 | #270 | Tragic 14.0% |
| Irish | 0.1 /100 | #271 | Tragic 14.0% |
| Mexicans | 0.1 /100 | #272 | Tragic 14.0% |