Hmong vs Immigrants from Congo Single Male Poverty
COMPARE
Hmong
Immigrants from Congo
Single Male Poverty
Single Male Poverty Comparison
Hmong
Immigrants from Congo
14.2%
SINGLE MALE POVERTY
0.0/ 100
METRIC RATING
280th/ 347
METRIC RANK
13.9%
SINGLE MALE POVERTY
0.2/ 100
METRIC RATING
265th/ 347
METRIC RANK
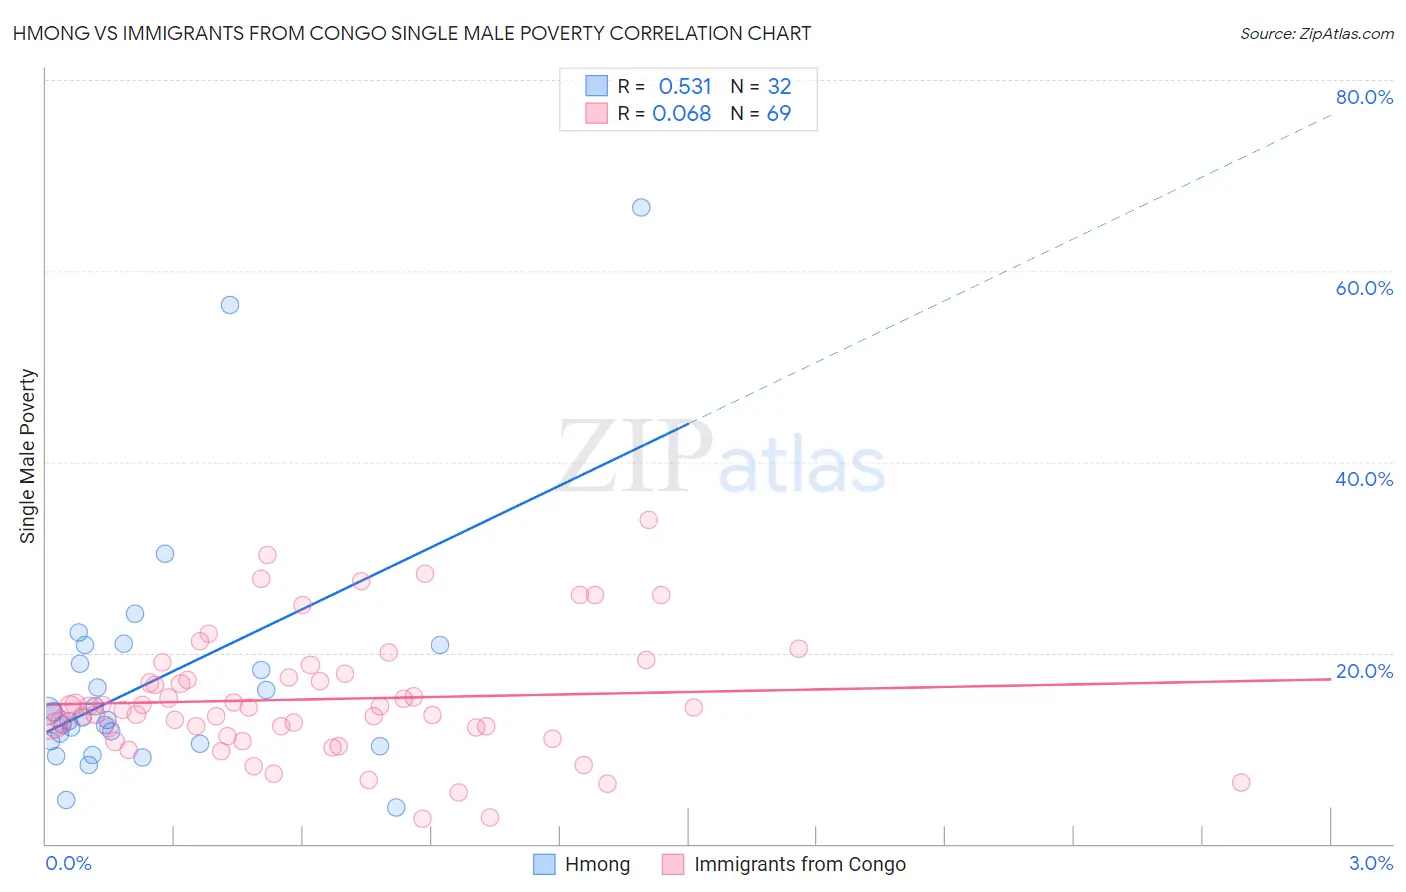
Hmong vs Immigrants from Congo Single Male Poverty Correlation Chart
The statistical analysis conducted on geographies consisting of 24,410,058 people shows a substantial positive correlation between the proportion of Hmong and poverty level among single males in the United States with a correlation coefficient (R) of 0.531 and weighted average of 14.2%. Similarly, the statistical analysis conducted on geographies consisting of 89,882,140 people shows a slight positive correlation between the proportion of Immigrants from Congo and poverty level among single males in the United States with a correlation coefficient (R) of 0.068 and weighted average of 13.9%, a difference of 2.3%.
Single Male Poverty Correlation Summary
| Measurement | Hmong | Immigrants from Congo |
| Minimum | 3.8% | 2.6% |
| Maximum | 66.7% | 33.9% |
| Range | 62.9% | 31.2% |
| Mean | 17.1% | 15.1% |
| Median | 13.0% | 14.3% |
| Interquartile 25% (IQ1) | 10.6% | 11.7% |
| Interquartile 75% (IQ3) | 19.8% | 17.7% |
| Interquartile Range (IQR) | 9.2% | 6.0% |
| Standard Deviation (Sample) | 13.0% | 6.4% |
| Standard Deviation (Population) | 12.8% | 6.4% |
Demographics Similar to Hmong and Immigrants from Congo by Single Male Poverty
In terms of single male poverty, the demographic groups most similar to Hmong are Hispanic or Latino (14.2%, a difference of 0.030%), Spanish American (14.2%, a difference of 0.18%), Indonesian (14.1%, a difference of 0.70%), Slovak (14.1%, a difference of 0.74%), and Immigrants from Honduras (14.1%, a difference of 0.81%). Similarly, the demographic groups most similar to Immigrants from Congo are West Indian (13.8%, a difference of 0.16%), Immigrants from Cabo Verde (13.9%, a difference of 0.31%), Cape Verdean (13.8%, a difference of 0.35%), Fijian (13.8%, a difference of 0.47%), and German (13.9%, a difference of 0.47%).
| Demographics | Rating | Rank | Single Male Poverty |
| Fijians | 0.3 /100 | #262 | Tragic 13.8% |
| Cape Verdeans | 0.2 /100 | #263 | Tragic 13.8% |
| West Indians | 0.2 /100 | #264 | Tragic 13.8% |
| Immigrants | Congo | 0.2 /100 | #265 | Tragic 13.9% |
| Immigrants | Cabo Verde | 0.1 /100 | #266 | Tragic 13.9% |
| Germans | 0.1 /100 | #267 | Tragic 13.9% |
| Immigrants | Mexico | 0.1 /100 | #268 | Tragic 13.9% |
| Scottish | 0.1 /100 | #269 | Tragic 14.0% |
| Immigrants | Saudi Arabia | 0.1 /100 | #270 | Tragic 14.0% |
| Irish | 0.1 /100 | #271 | Tragic 14.0% |
| Mexicans | 0.1 /100 | #272 | Tragic 14.0% |
| Welsh | 0.1 /100 | #273 | Tragic 14.0% |
| Hondurans | 0.1 /100 | #274 | Tragic 14.0% |
| English | 0.1 /100 | #275 | Tragic 14.1% |
| Dutch | 0.1 /100 | #276 | Tragic 14.1% |
| Immigrants | Honduras | 0.0 /100 | #277 | Tragic 14.1% |
| Slovaks | 0.0 /100 | #278 | Tragic 14.1% |
| Indonesians | 0.0 /100 | #279 | Tragic 14.1% |
| Hmong | 0.0 /100 | #280 | Tragic 14.2% |
| Hispanics or Latinos | 0.0 /100 | #281 | Tragic 14.2% |
| Spanish Americans | 0.0 /100 | #282 | Tragic 14.2% |