Tohono O'odham vs Immigrants from Congo Single Male Poverty
COMPARE
Tohono O'odham
Immigrants from Congo
Single Male Poverty
Single Male Poverty Comparison
Tohono O'odham
Immigrants from Congo
21.6%
SINGLE MALE POVERTY
0.0/ 100
METRIC RATING
336th/ 347
METRIC RANK
13.9%
SINGLE MALE POVERTY
0.2/ 100
METRIC RATING
265th/ 347
METRIC RANK
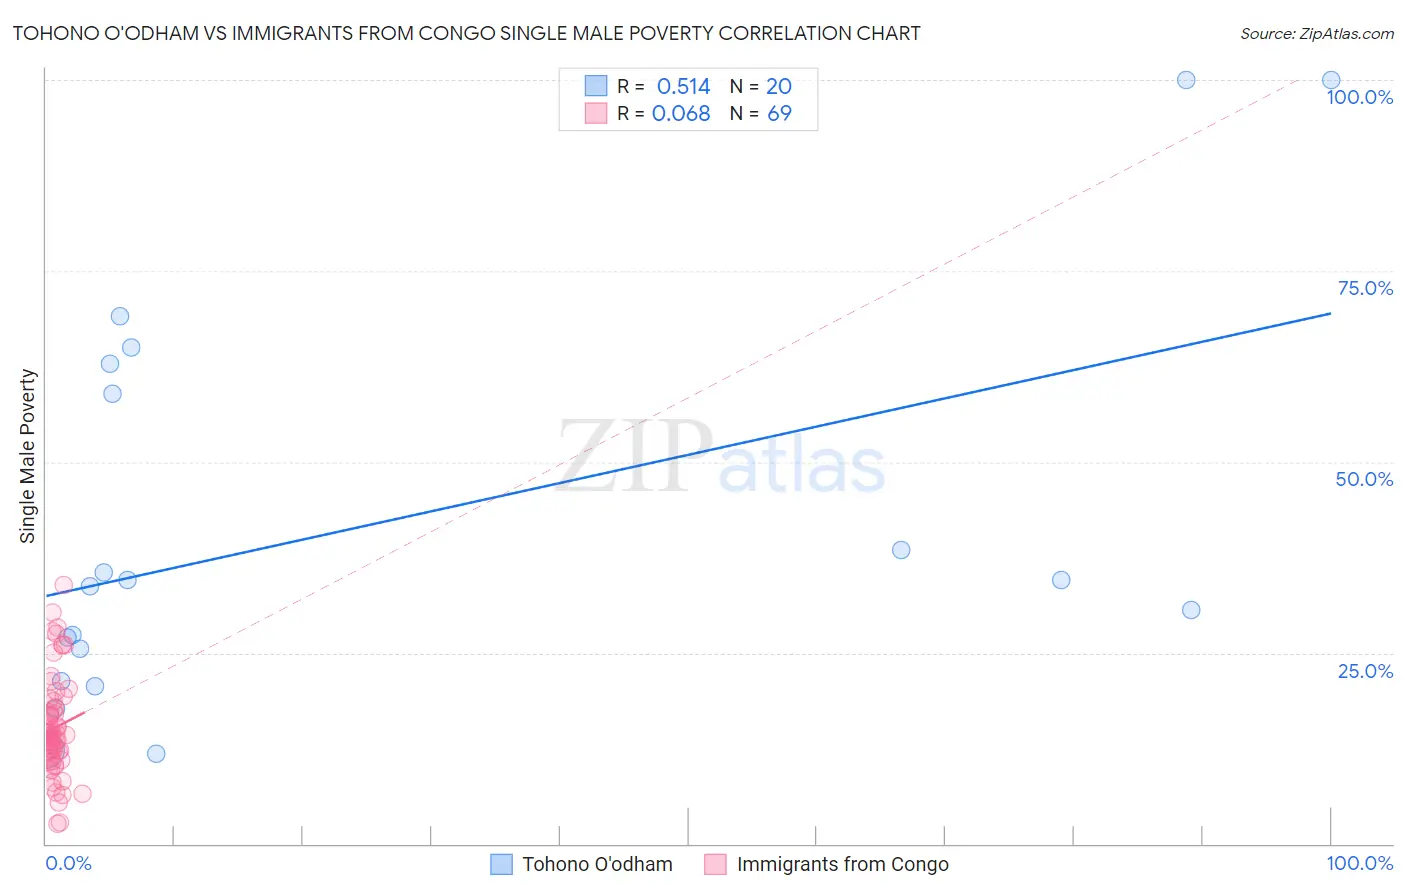
Tohono O'odham vs Immigrants from Congo Single Male Poverty Correlation Chart
The statistical analysis conducted on geographies consisting of 57,748,235 people shows a substantial positive correlation between the proportion of Tohono O'odham and poverty level among single males in the United States with a correlation coefficient (R) of 0.514 and weighted average of 21.6%. Similarly, the statistical analysis conducted on geographies consisting of 89,882,140 people shows a slight positive correlation between the proportion of Immigrants from Congo and poverty level among single males in the United States with a correlation coefficient (R) of 0.068 and weighted average of 13.9%, a difference of 55.4%.
Single Male Poverty Correlation Summary
| Measurement | Tohono O'odham | Immigrants from Congo |
| Minimum | 11.9% | 2.6% |
| Maximum | 100.0% | 33.9% |
| Range | 88.1% | 31.2% |
| Mean | 41.3% | 15.1% |
| Median | 34.1% | 14.3% |
| Interquartile 25% (IQ1) | 23.4% | 11.7% |
| Interquartile 75% (IQ3) | 60.9% | 17.7% |
| Interquartile Range (IQR) | 37.5% | 6.0% |
| Standard Deviation (Sample) | 26.2% | 6.4% |
| Standard Deviation (Population) | 25.6% | 6.4% |
Similar Demographics by Single Male Poverty
Demographics Similar to Tohono O'odham by Single Male Poverty
In terms of single male poverty, the demographic groups most similar to Tohono O'odham are Apache (21.6%, a difference of 0.10%), Pueblo (21.6%, a difference of 0.28%), Yuman (21.3%, a difference of 1.2%), Arapaho (21.9%, a difference of 1.8%), and Sioux (22.2%, a difference of 3.1%).
| Demographics | Rating | Rank | Single Male Poverty |
| Colville | 0.0 /100 | #329 | Tragic 18.4% |
| Cajuns | 0.0 /100 | #330 | Tragic 19.1% |
| Paiute | 0.0 /100 | #331 | Tragic 19.3% |
| Natives/Alaskans | 0.0 /100 | #332 | Tragic 19.6% |
| Inupiat | 0.0 /100 | #333 | Tragic 20.0% |
| Pima | 0.0 /100 | #334 | Tragic 20.2% |
| Yuman | 0.0 /100 | #335 | Tragic 21.3% |
| Tohono O'odham | 0.0 /100 | #336 | Tragic 21.6% |
| Apache | 0.0 /100 | #337 | Tragic 21.6% |
| Pueblo | 0.0 /100 | #338 | Tragic 21.6% |
| Arapaho | 0.0 /100 | #339 | Tragic 21.9% |
| Sioux | 0.0 /100 | #340 | Tragic 22.2% |
| Crow | 0.0 /100 | #341 | Tragic 23.3% |
| Houma | 0.0 /100 | #342 | Tragic 23.5% |
| Puerto Ricans | 0.0 /100 | #343 | Tragic 25.1% |
Demographics Similar to Immigrants from Congo by Single Male Poverty
In terms of single male poverty, the demographic groups most similar to Immigrants from Congo are West Indian (13.8%, a difference of 0.16%), Immigrants from Cabo Verde (13.9%, a difference of 0.31%), Cape Verdean (13.8%, a difference of 0.35%), Fijian (13.8%, a difference of 0.47%), and German (13.9%, a difference of 0.47%).
| Demographics | Rating | Rank | Single Male Poverty |
| Immigrants | Guatemala | 0.3 /100 | #258 | Tragic 13.8% |
| Guatemalans | 0.3 /100 | #259 | Tragic 13.8% |
| Swiss | 0.3 /100 | #260 | Tragic 13.8% |
| Hungarians | 0.3 /100 | #261 | Tragic 13.8% |
| Fijians | 0.3 /100 | #262 | Tragic 13.8% |
| Cape Verdeans | 0.2 /100 | #263 | Tragic 13.8% |
| West Indians | 0.2 /100 | #264 | Tragic 13.8% |
| Immigrants | Congo | 0.2 /100 | #265 | Tragic 13.9% |
| Immigrants | Cabo Verde | 0.1 /100 | #266 | Tragic 13.9% |
| Germans | 0.1 /100 | #267 | Tragic 13.9% |
| Immigrants | Mexico | 0.1 /100 | #268 | Tragic 13.9% |
| Scottish | 0.1 /100 | #269 | Tragic 14.0% |
| Immigrants | Saudi Arabia | 0.1 /100 | #270 | Tragic 14.0% |
| Irish | 0.1 /100 | #271 | Tragic 14.0% |
| Mexicans | 0.1 /100 | #272 | Tragic 14.0% |