Moroccan vs Immigrants from Congo Single Male Poverty
COMPARE
Moroccan
Immigrants from Congo
Single Male Poverty
Single Male Poverty Comparison
Moroccans
Immigrants from Congo
12.9%
SINGLE MALE POVERTY
36.8/ 100
METRIC RATING
182nd/ 347
METRIC RANK
13.9%
SINGLE MALE POVERTY
0.2/ 100
METRIC RATING
265th/ 347
METRIC RANK
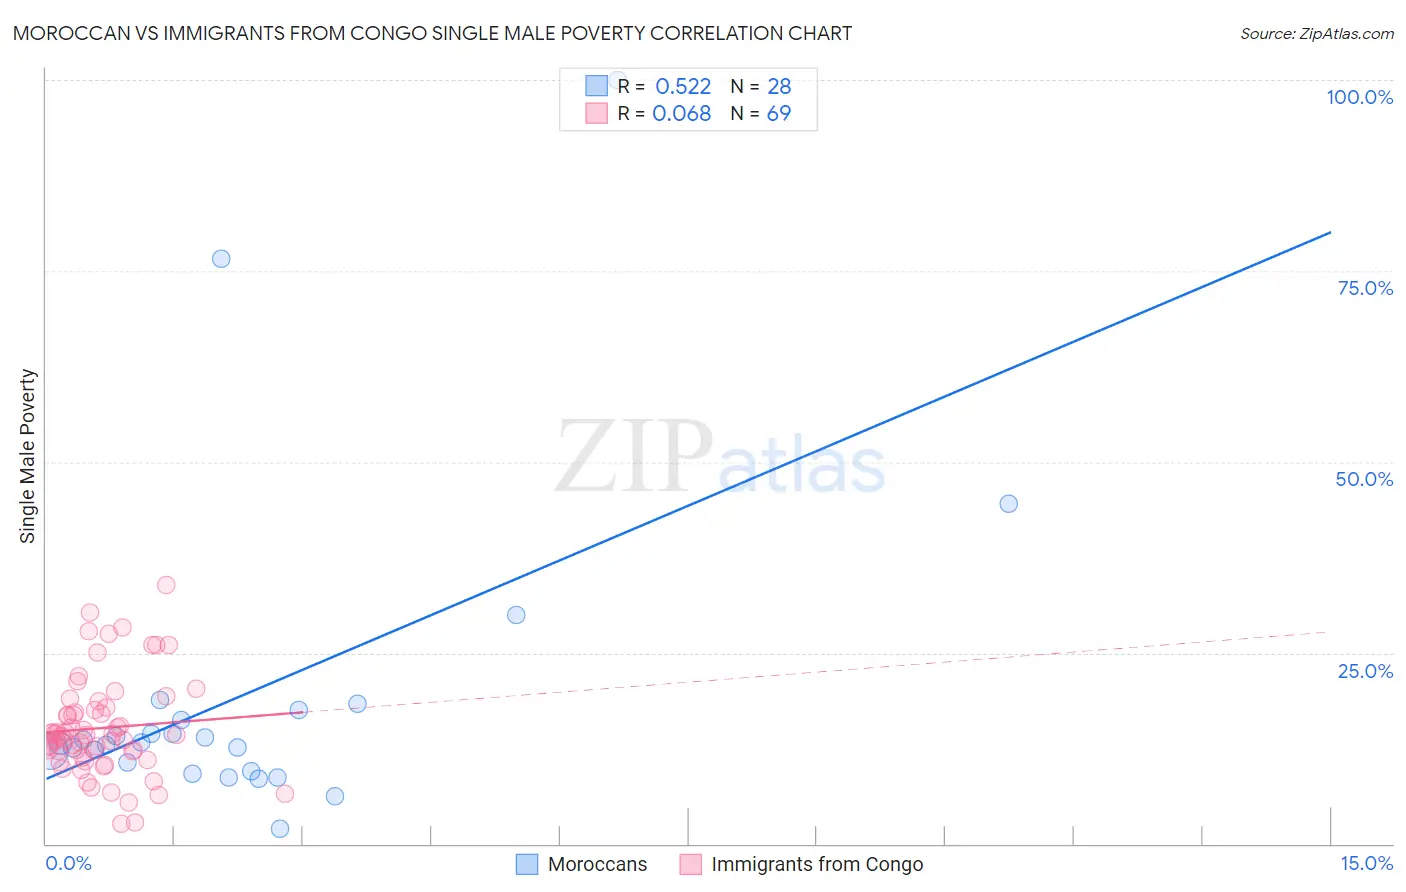
Moroccan vs Immigrants from Congo Single Male Poverty Correlation Chart
The statistical analysis conducted on geographies consisting of 188,123,639 people shows a substantial positive correlation between the proportion of Moroccans and poverty level among single males in the United States with a correlation coefficient (R) of 0.522 and weighted average of 12.9%. Similarly, the statistical analysis conducted on geographies consisting of 89,882,140 people shows a slight positive correlation between the proportion of Immigrants from Congo and poverty level among single males in the United States with a correlation coefficient (R) of 0.068 and weighted average of 13.9%, a difference of 7.6%.
Single Male Poverty Correlation Summary
| Measurement | Moroccan | Immigrants from Congo |
| Minimum | 1.9% | 2.6% |
| Maximum | 100.0% | 33.9% |
| Range | 98.1% | 31.2% |
| Mean | 19.4% | 15.1% |
| Median | 13.2% | 14.3% |
| Interquartile 25% (IQ1) | 10.0% | 11.7% |
| Interquartile 75% (IQ3) | 16.9% | 17.7% |
| Interquartile Range (IQR) | 6.9% | 6.0% |
| Standard Deviation (Sample) | 21.2% | 6.4% |
| Standard Deviation (Population) | 20.8% | 6.4% |
Similar Demographics by Single Male Poverty
Demographics Similar to Moroccans by Single Male Poverty
In terms of single male poverty, the demographic groups most similar to Moroccans are Panamanian (12.9%, a difference of 0.040%), Immigrants from North America (12.9%, a difference of 0.050%), Immigrants from West Indies (12.9%, a difference of 0.22%), Israeli (12.9%, a difference of 0.23%), and Immigrants from Trinidad and Tobago (12.9%, a difference of 0.25%).
| Demographics | Rating | Rank | Single Male Poverty |
| Croatians | 48.9 /100 | #175 | Average 12.8% |
| Syrians | 48.4 /100 | #176 | Average 12.8% |
| Immigrants | Canada | 44.8 /100 | #177 | Average 12.8% |
| Immigrants | Switzerland | 43.1 /100 | #178 | Average 12.8% |
| Israelis | 41.0 /100 | #179 | Average 12.9% |
| Immigrants | North America | 37.7 /100 | #180 | Fair 12.9% |
| Panamanians | 37.6 /100 | #181 | Fair 12.9% |
| Moroccans | 36.8 /100 | #182 | Fair 12.9% |
| Immigrants | West Indies | 33.0 /100 | #183 | Fair 12.9% |
| Immigrants | Trinidad and Tobago | 32.5 /100 | #184 | Fair 12.9% |
| Norwegians | 32.0 /100 | #185 | Fair 12.9% |
| Nigerians | 31.9 /100 | #186 | Fair 12.9% |
| Immigrants | Kuwait | 31.9 /100 | #187 | Fair 12.9% |
| Macedonians | 31.5 /100 | #188 | Fair 12.9% |
| Portuguese | 30.2 /100 | #189 | Fair 12.9% |
Demographics Similar to Immigrants from Congo by Single Male Poverty
In terms of single male poverty, the demographic groups most similar to Immigrants from Congo are West Indian (13.8%, a difference of 0.16%), Immigrants from Cabo Verde (13.9%, a difference of 0.31%), Cape Verdean (13.8%, a difference of 0.35%), Fijian (13.8%, a difference of 0.47%), and German (13.9%, a difference of 0.47%).
| Demographics | Rating | Rank | Single Male Poverty |
| Immigrants | Guatemala | 0.3 /100 | #258 | Tragic 13.8% |
| Guatemalans | 0.3 /100 | #259 | Tragic 13.8% |
| Swiss | 0.3 /100 | #260 | Tragic 13.8% |
| Hungarians | 0.3 /100 | #261 | Tragic 13.8% |
| Fijians | 0.3 /100 | #262 | Tragic 13.8% |
| Cape Verdeans | 0.2 /100 | #263 | Tragic 13.8% |
| West Indians | 0.2 /100 | #264 | Tragic 13.8% |
| Immigrants | Congo | 0.2 /100 | #265 | Tragic 13.9% |
| Immigrants | Cabo Verde | 0.1 /100 | #266 | Tragic 13.9% |
| Germans | 0.1 /100 | #267 | Tragic 13.9% |
| Immigrants | Mexico | 0.1 /100 | #268 | Tragic 13.9% |
| Scottish | 0.1 /100 | #269 | Tragic 14.0% |
| Immigrants | Saudi Arabia | 0.1 /100 | #270 | Tragic 14.0% |
| Irish | 0.1 /100 | #271 | Tragic 14.0% |
| Mexicans | 0.1 /100 | #272 | Tragic 14.0% |