Black/African American vs Immigrants from Netherlands Single Female Poverty
COMPARE
Black/African American
Immigrants from Netherlands
Single Female Poverty
Single Female Poverty Comparison
Blacks/African Americans
Immigrants from Netherlands
26.4%
SINGLE FEMALE POVERTY
0.0/ 100
METRIC RATING
319th/ 347
METRIC RANK
20.0%
SINGLE FEMALE POVERTY
96.0/ 100
METRIC RATING
112th/ 347
METRIC RANK
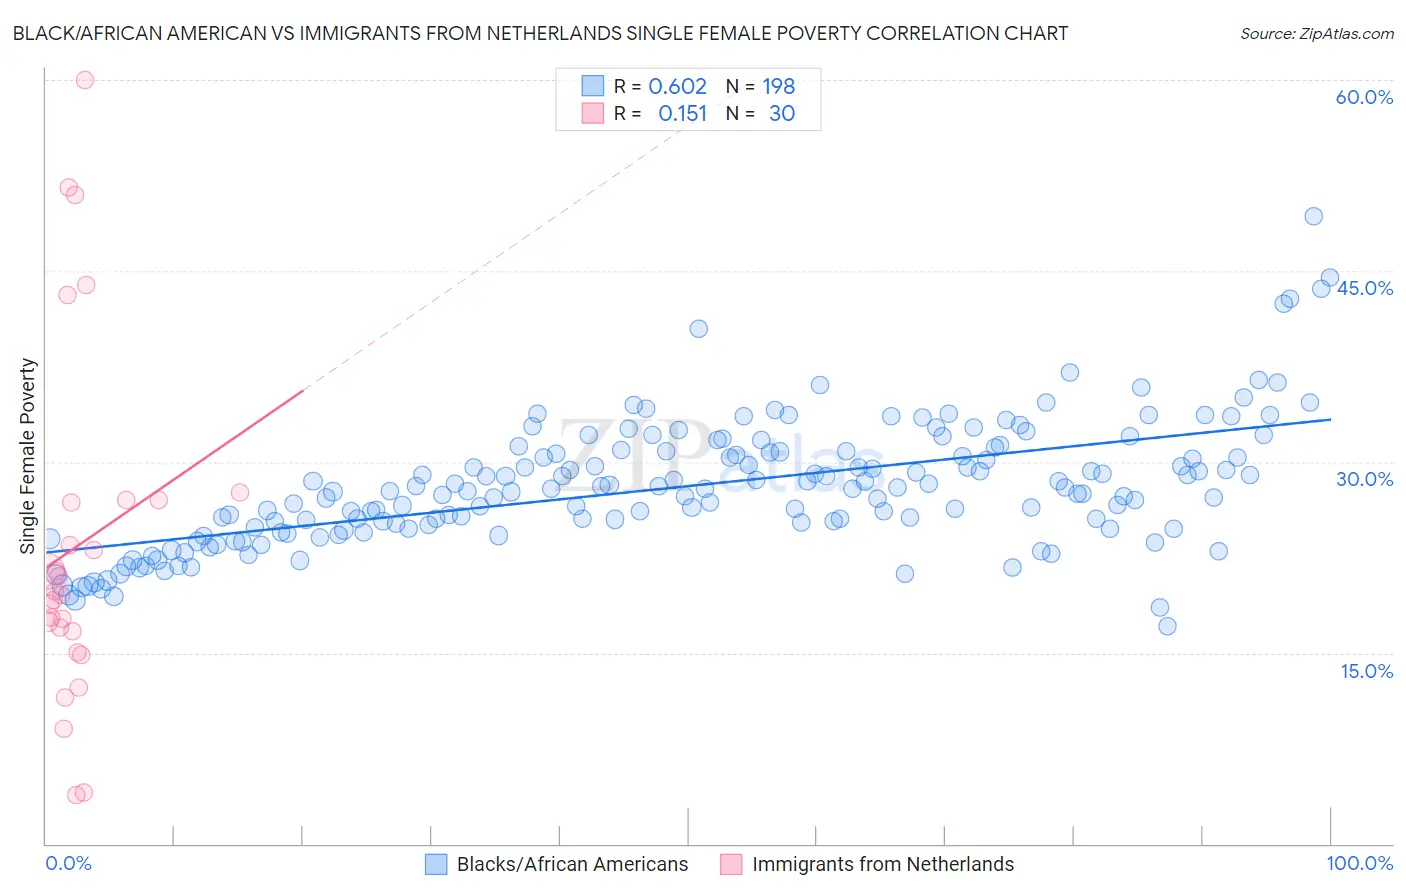
Black/African American vs Immigrants from Netherlands Single Female Poverty Correlation Chart
The statistical analysis conducted on geographies consisting of 548,844,425 people shows a significant positive correlation between the proportion of Blacks/African Americans and poverty level among single females in the United States with a correlation coefficient (R) of 0.602 and weighted average of 26.4%. Similarly, the statistical analysis conducted on geographies consisting of 234,903,097 people shows a poor positive correlation between the proportion of Immigrants from Netherlands and poverty level among single females in the United States with a correlation coefficient (R) of 0.151 and weighted average of 20.0%, a difference of 32.0%.
Single Female Poverty Correlation Summary
| Measurement | Black/African American | Immigrants from Netherlands |
| Minimum | 17.1% | 3.8% |
| Maximum | 49.3% | 60.0% |
| Range | 32.1% | 56.2% |
| Mean | 28.1% | 23.4% |
| Median | 27.8% | 19.7% |
| Interquartile 25% (IQ1) | 24.8% | 16.7% |
| Interquartile 75% (IQ3) | 30.8% | 27.0% |
| Interquartile Range (IQR) | 6.0% | 10.4% |
| Standard Deviation (Sample) | 5.0% | 13.6% |
| Standard Deviation (Population) | 5.0% | 13.4% |
Similar Demographics by Single Female Poverty
Demographics Similar to Blacks/African Americans by Single Female Poverty
In terms of single female poverty, the demographic groups most similar to Blacks/African Americans are Arapaho (26.4%, a difference of 0.30%), Chickasaw (26.3%, a difference of 0.33%), Yup'ik (26.6%, a difference of 0.95%), Ottawa (26.0%, a difference of 1.4%), and Seminole (26.8%, a difference of 1.7%).
| Demographics | Rating | Rank | Single Female Poverty |
| Paiute | 0.0 /100 | #312 | Tragic 25.5% |
| Comanche | 0.0 /100 | #313 | Tragic 25.6% |
| Cherokee | 0.0 /100 | #314 | Tragic 25.7% |
| Iroquois | 0.0 /100 | #315 | Tragic 25.7% |
| Immigrants | Somalia | 0.0 /100 | #316 | Tragic 25.8% |
| Ottawa | 0.0 /100 | #317 | Tragic 26.0% |
| Chickasaw | 0.0 /100 | #318 | Tragic 26.3% |
| Blacks/African Americans | 0.0 /100 | #319 | Tragic 26.4% |
| Arapaho | 0.0 /100 | #320 | Tragic 26.4% |
| Yup'ik | 0.0 /100 | #321 | Tragic 26.6% |
| Seminole | 0.0 /100 | #322 | Tragic 26.8% |
| Chippewa | 0.0 /100 | #323 | Tragic 26.8% |
| Kiowa | 0.0 /100 | #324 | Tragic 26.9% |
| Choctaw | 0.0 /100 | #325 | Tragic 27.2% |
| Creek | 0.0 /100 | #326 | Tragic 27.4% |
Demographics Similar to Immigrants from Netherlands by Single Female Poverty
In terms of single female poverty, the demographic groups most similar to Immigrants from Netherlands are Immigrants from Zimbabwe (20.0%, a difference of 0.050%), Carpatho Rusyn (20.0%, a difference of 0.060%), Immigrants from Colombia (20.0%, a difference of 0.060%), Immigrants from Northern Africa (20.0%, a difference of 0.070%), and Immigrants from Kazakhstan (20.0%, a difference of 0.11%).
| Demographics | Rating | Rank | Single Female Poverty |
| Israelis | 96.9 /100 | #105 | Exceptional 19.9% |
| Ethiopians | 96.7 /100 | #106 | Exceptional 19.9% |
| Immigrants | Syria | 96.7 /100 | #107 | Exceptional 19.9% |
| Native Hawaiians | 96.6 /100 | #108 | Exceptional 19.9% |
| Colombians | 96.6 /100 | #109 | Exceptional 19.9% |
| Immigrants | Western Asia | 96.5 /100 | #110 | Exceptional 19.9% |
| Carpatho Rusyns | 96.1 /100 | #111 | Exceptional 20.0% |
| Immigrants | Netherlands | 96.0 /100 | #112 | Exceptional 20.0% |
| Immigrants | Zimbabwe | 95.9 /100 | #113 | Exceptional 20.0% |
| Immigrants | Colombia | 95.9 /100 | #114 | Exceptional 20.0% |
| Immigrants | Northern Africa | 95.8 /100 | #115 | Exceptional 20.0% |
| Immigrants | Kazakhstan | 95.7 /100 | #116 | Exceptional 20.0% |
| Poles | 95.6 /100 | #117 | Exceptional 20.0% |
| Immigrants | Afghanistan | 95.4 /100 | #118 | Exceptional 20.0% |
| Immigrants | Ethiopia | 95.4 /100 | #119 | Exceptional 20.0% |