Syrian vs Immigrants from Netherlands Single Female Poverty
COMPARE
Syrian
Immigrants from Netherlands
Single Female Poverty
Single Female Poverty Comparison
Syrians
Immigrants from Netherlands
20.3%
SINGLE FEMALE POVERTY
90.4/ 100
METRIC RATING
140th/ 347
METRIC RANK
20.0%
SINGLE FEMALE POVERTY
96.0/ 100
METRIC RATING
112th/ 347
METRIC RANK
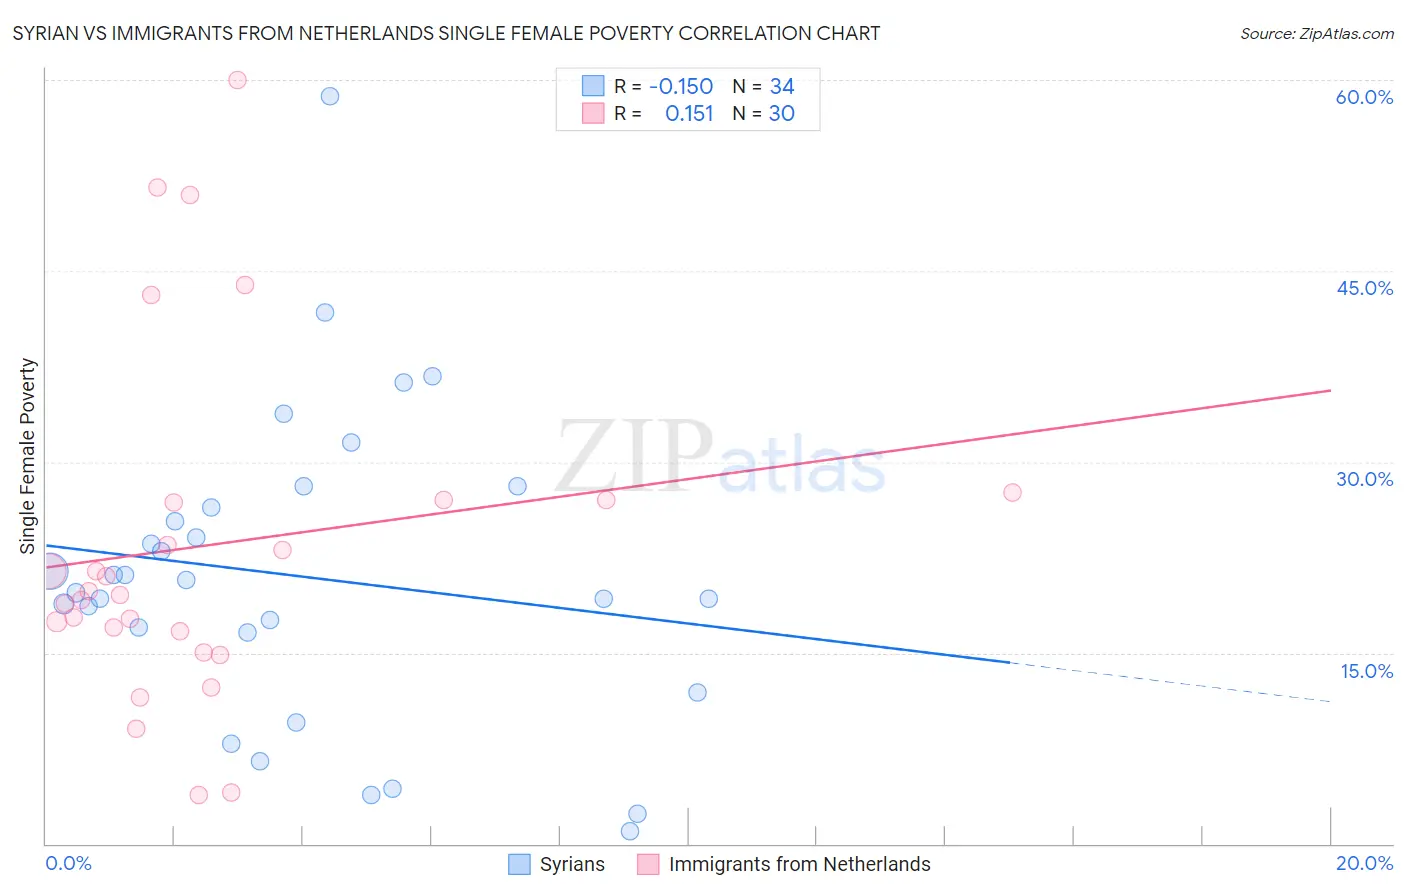
Syrian vs Immigrants from Netherlands Single Female Poverty Correlation Chart
The statistical analysis conducted on geographies consisting of 263,006,420 people shows a poor negative correlation between the proportion of Syrians and poverty level among single females in the United States with a correlation coefficient (R) of -0.150 and weighted average of 20.3%. Similarly, the statistical analysis conducted on geographies consisting of 234,903,097 people shows a poor positive correlation between the proportion of Immigrants from Netherlands and poverty level among single females in the United States with a correlation coefficient (R) of 0.151 and weighted average of 20.0%, a difference of 1.5%.
Single Female Poverty Correlation Summary
| Measurement | Syrian | Immigrants from Netherlands |
| Minimum | 0.97% | 3.8% |
| Maximum | 58.7% | 60.0% |
| Range | 57.7% | 56.2% |
| Mean | 21.0% | 23.4% |
| Median | 20.2% | 19.7% |
| Interquartile 25% (IQ1) | 16.6% | 16.7% |
| Interquartile 75% (IQ3) | 26.4% | 27.0% |
| Interquartile Range (IQR) | 9.8% | 10.4% |
| Standard Deviation (Sample) | 12.0% | 13.6% |
| Standard Deviation (Population) | 11.8% | 13.4% |
Similar Demographics by Single Female Poverty
Demographics Similar to Syrians by Single Female Poverty
In terms of single female poverty, the demographic groups most similar to Syrians are Slovene (20.3%, a difference of 0.010%), Immigrants from Kuwait (20.3%, a difference of 0.010%), Immigrants from Nepal (20.3%, a difference of 0.050%), Immigrants from North America (20.3%, a difference of 0.15%), and Immigrants from Iraq (20.2%, a difference of 0.16%).
| Demographics | Rating | Rank | Single Female Poverty |
| Immigrants | England | 91.9 /100 | #133 | Exceptional 20.2% |
| Immigrants | Venezuela | 91.5 /100 | #134 | Exceptional 20.2% |
| Immigrants | Iraq | 91.2 /100 | #135 | Exceptional 20.2% |
| Immigrants | Canada | 91.2 /100 | #136 | Exceptional 20.2% |
| Immigrants | Nepal | 90.6 /100 | #137 | Exceptional 20.3% |
| Slovenes | 90.5 /100 | #138 | Exceptional 20.3% |
| Immigrants | Kuwait | 90.4 /100 | #139 | Exceptional 20.3% |
| Syrians | 90.4 /100 | #140 | Exceptional 20.3% |
| Immigrants | North America | 89.5 /100 | #141 | Excellent 20.3% |
| Immigrants | Uganda | 89.1 /100 | #142 | Excellent 20.3% |
| Australians | 88.4 /100 | #143 | Excellent 20.3% |
| Immigrants | Uzbekistan | 88.3 /100 | #144 | Excellent 20.3% |
| Austrians | 85.8 /100 | #145 | Excellent 20.4% |
| Venezuelans | 85.5 /100 | #146 | Excellent 20.4% |
| South Africans | 85.3 /100 | #147 | Excellent 20.4% |
Demographics Similar to Immigrants from Netherlands by Single Female Poverty
In terms of single female poverty, the demographic groups most similar to Immigrants from Netherlands are Immigrants from Zimbabwe (20.0%, a difference of 0.050%), Carpatho Rusyn (20.0%, a difference of 0.060%), Immigrants from Colombia (20.0%, a difference of 0.060%), Immigrants from Northern Africa (20.0%, a difference of 0.070%), and Immigrants from Kazakhstan (20.0%, a difference of 0.11%).
| Demographics | Rating | Rank | Single Female Poverty |
| Israelis | 96.9 /100 | #105 | Exceptional 19.9% |
| Ethiopians | 96.7 /100 | #106 | Exceptional 19.9% |
| Immigrants | Syria | 96.7 /100 | #107 | Exceptional 19.9% |
| Native Hawaiians | 96.6 /100 | #108 | Exceptional 19.9% |
| Colombians | 96.6 /100 | #109 | Exceptional 19.9% |
| Immigrants | Western Asia | 96.5 /100 | #110 | Exceptional 19.9% |
| Carpatho Rusyns | 96.1 /100 | #111 | Exceptional 20.0% |
| Immigrants | Netherlands | 96.0 /100 | #112 | Exceptional 20.0% |
| Immigrants | Zimbabwe | 95.9 /100 | #113 | Exceptional 20.0% |
| Immigrants | Colombia | 95.9 /100 | #114 | Exceptional 20.0% |
| Immigrants | Northern Africa | 95.8 /100 | #115 | Exceptional 20.0% |
| Immigrants | Kazakhstan | 95.7 /100 | #116 | Exceptional 20.0% |
| Poles | 95.6 /100 | #117 | Exceptional 20.0% |
| Immigrants | Afghanistan | 95.4 /100 | #118 | Exceptional 20.0% |
| Immigrants | Ethiopia | 95.4 /100 | #119 | Exceptional 20.0% |