Black/African American vs Immigrants from Philippines Single Female Poverty
COMPARE
Black/African American
Immigrants from Philippines
Single Female Poverty
Single Female Poverty Comparison
Blacks/African Americans
Immigrants from Philippines
26.4%
SINGLE FEMALE POVERTY
0.0/ 100
METRIC RATING
319th/ 347
METRIC RANK
18.6%
SINGLE FEMALE POVERTY
99.9/ 100
METRIC RATING
33rd/ 347
METRIC RANK
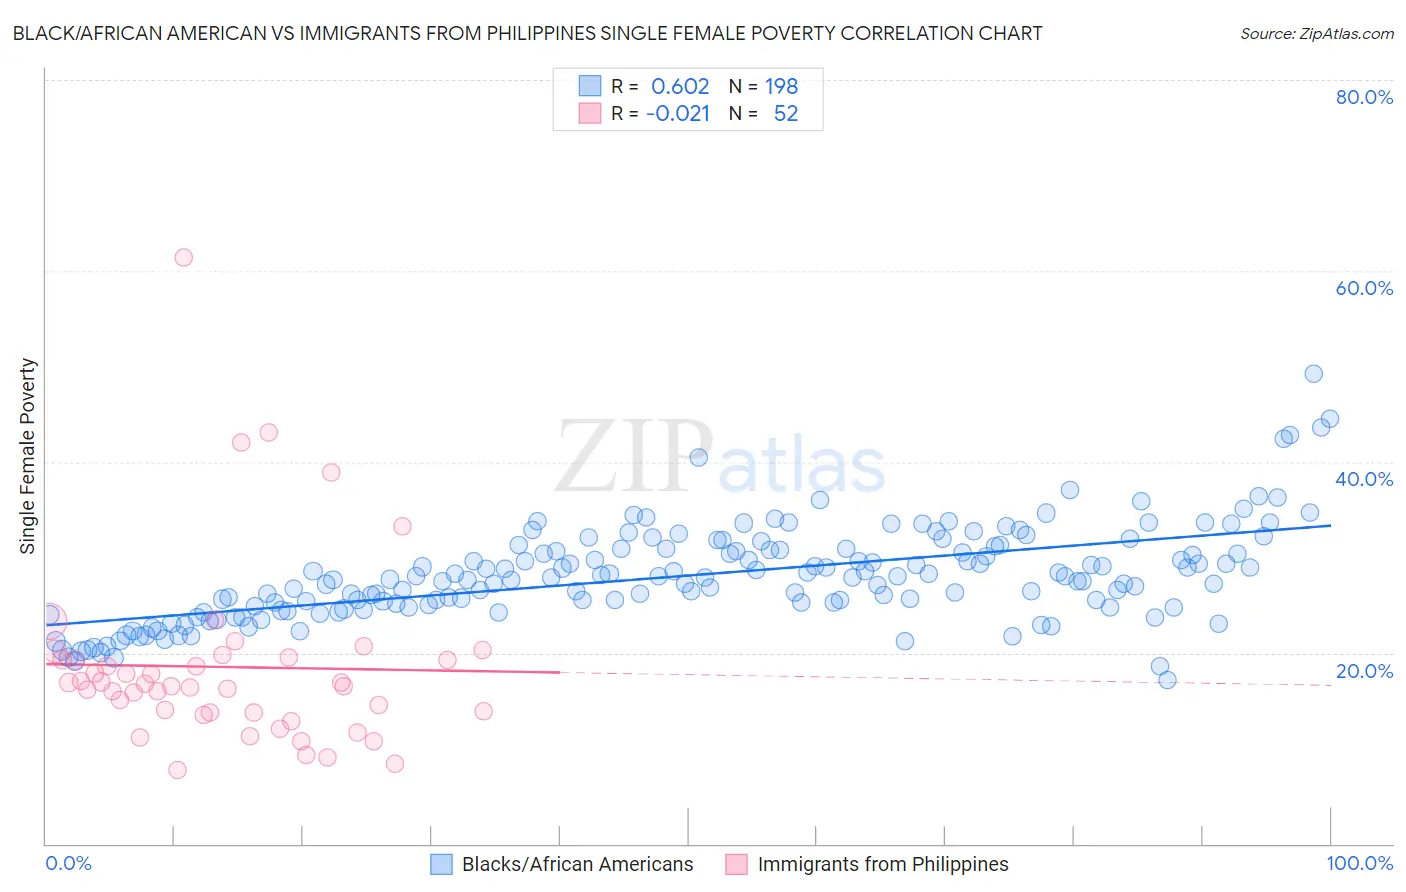
Black/African American vs Immigrants from Philippines Single Female Poverty Correlation Chart
The statistical analysis conducted on geographies consisting of 548,844,425 people shows a significant positive correlation between the proportion of Blacks/African Americans and poverty level among single females in the United States with a correlation coefficient (R) of 0.602 and weighted average of 26.4%. Similarly, the statistical analysis conducted on geographies consisting of 462,433,577 people shows no correlation between the proportion of Immigrants from Philippines and poverty level among single females in the United States with a correlation coefficient (R) of -0.021 and weighted average of 18.6%, a difference of 41.8%.
Single Female Poverty Correlation Summary
| Measurement | Black/African American | Immigrants from Philippines |
| Minimum | 17.1% | 7.7% |
| Maximum | 49.3% | 61.4% |
| Range | 32.1% | 53.7% |
| Mean | 28.1% | 18.5% |
| Median | 27.8% | 16.6% |
| Interquartile 25% (IQ1) | 24.8% | 13.8% |
| Interquartile 75% (IQ3) | 30.8% | 19.4% |
| Interquartile Range (IQR) | 6.0% | 5.6% |
| Standard Deviation (Sample) | 5.0% | 9.5% |
| Standard Deviation (Population) | 5.0% | 9.4% |
Similar Demographics by Single Female Poverty
Demographics Similar to Blacks/African Americans by Single Female Poverty
In terms of single female poverty, the demographic groups most similar to Blacks/African Americans are Arapaho (26.4%, a difference of 0.30%), Chickasaw (26.3%, a difference of 0.33%), Yup'ik (26.6%, a difference of 0.95%), Ottawa (26.0%, a difference of 1.4%), and Seminole (26.8%, a difference of 1.7%).
| Demographics | Rating | Rank | Single Female Poverty |
| Paiute | 0.0 /100 | #312 | Tragic 25.5% |
| Comanche | 0.0 /100 | #313 | Tragic 25.6% |
| Cherokee | 0.0 /100 | #314 | Tragic 25.7% |
| Iroquois | 0.0 /100 | #315 | Tragic 25.7% |
| Immigrants | Somalia | 0.0 /100 | #316 | Tragic 25.8% |
| Ottawa | 0.0 /100 | #317 | Tragic 26.0% |
| Chickasaw | 0.0 /100 | #318 | Tragic 26.3% |
| Blacks/African Americans | 0.0 /100 | #319 | Tragic 26.4% |
| Arapaho | 0.0 /100 | #320 | Tragic 26.4% |
| Yup'ik | 0.0 /100 | #321 | Tragic 26.6% |
| Seminole | 0.0 /100 | #322 | Tragic 26.8% |
| Chippewa | 0.0 /100 | #323 | Tragic 26.8% |
| Kiowa | 0.0 /100 | #324 | Tragic 26.9% |
| Choctaw | 0.0 /100 | #325 | Tragic 27.2% |
| Creek | 0.0 /100 | #326 | Tragic 27.4% |
Demographics Similar to Immigrants from Philippines by Single Female Poverty
In terms of single female poverty, the demographic groups most similar to Immigrants from Philippines are Immigrants from Sri Lanka (18.6%, a difference of 0.060%), Immigrants from Asia (18.6%, a difference of 0.15%), Korean (18.6%, a difference of 0.18%), Immigrants from North Macedonia (18.5%, a difference of 0.20%), and Immigrants from Japan (18.6%, a difference of 0.24%).
| Demographics | Rating | Rank | Single Female Poverty |
| Immigrants | Israel | 100.0 /100 | #26 | Exceptional 18.3% |
| Immigrants | Pakistan | 100.0 /100 | #27 | Exceptional 18.4% |
| Immigrants | Moldova | 100.0 /100 | #28 | Exceptional 18.5% |
| Immigrants | Poland | 100.0 /100 | #29 | Exceptional 18.5% |
| Immigrants | North Macedonia | 99.9 /100 | #30 | Exceptional 18.5% |
| Immigrants | Asia | 99.9 /100 | #31 | Exceptional 18.6% |
| Immigrants | Sri Lanka | 99.9 /100 | #32 | Exceptional 18.6% |
| Immigrants | Philippines | 99.9 /100 | #33 | Exceptional 18.6% |
| Koreans | 99.9 /100 | #34 | Exceptional 18.6% |
| Immigrants | Japan | 99.9 /100 | #35 | Exceptional 18.6% |
| Turks | 99.9 /100 | #36 | Exceptional 18.7% |
| Immigrants | Armenia | 99.9 /100 | #37 | Exceptional 18.7% |
| Tongans | 99.9 /100 | #38 | Exceptional 18.8% |
| Bulgarians | 99.9 /100 | #39 | Exceptional 18.8% |
| Okinawans | 99.9 /100 | #40 | Exceptional 18.8% |