Italian vs Immigrants from Netherlands Single Female Poverty
COMPARE
Italian
Immigrants from Netherlands
Single Female Poverty
Single Female Poverty Comparison
Italians
Immigrants from Netherlands
19.6%
SINGLE FEMALE POVERTY
98.8/ 100
METRIC RATING
92nd/ 347
METRIC RANK
20.0%
SINGLE FEMALE POVERTY
96.0/ 100
METRIC RATING
112th/ 347
METRIC RANK
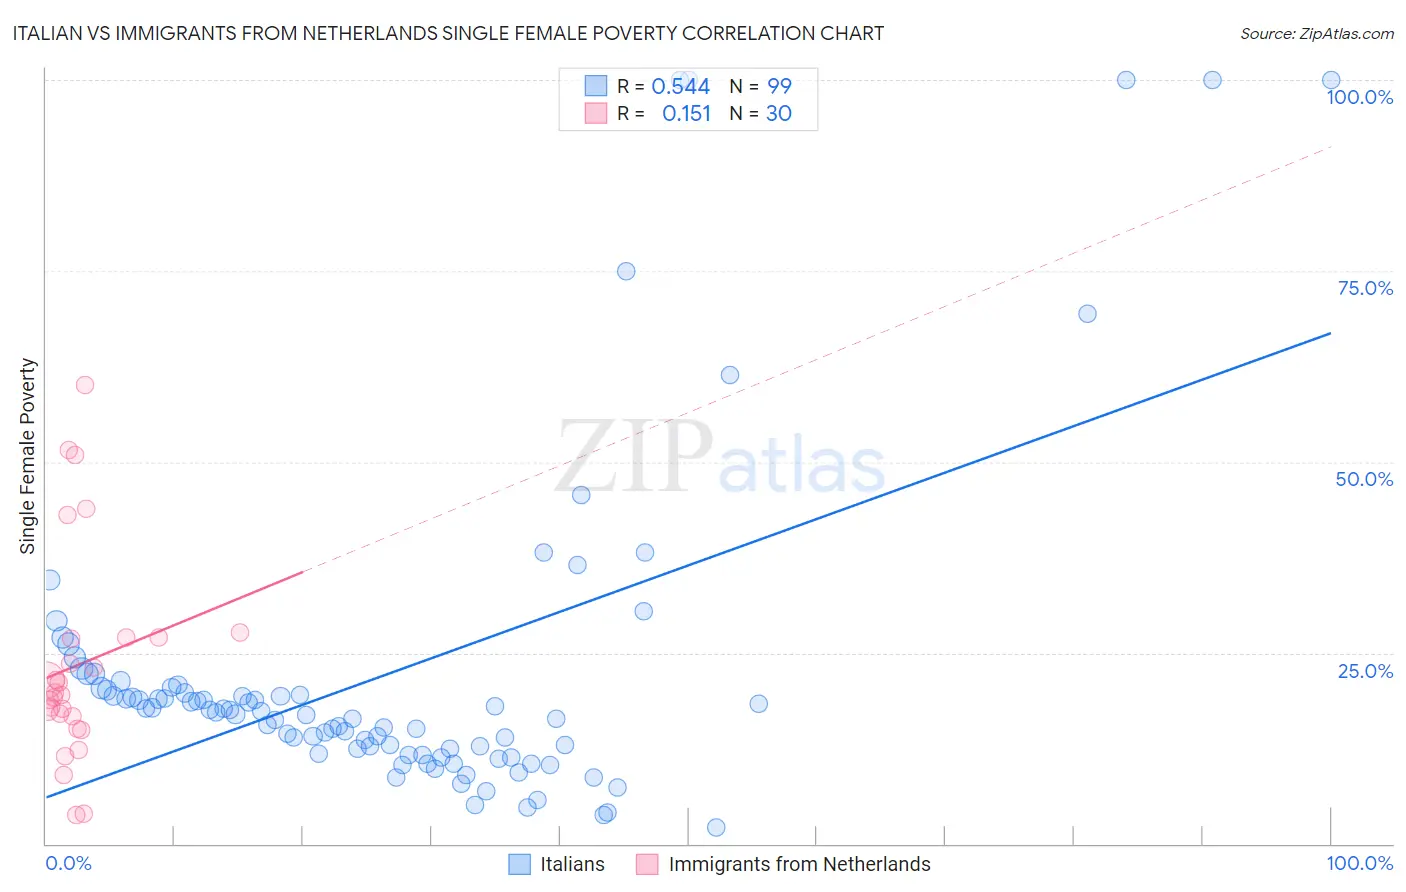
Italian vs Immigrants from Netherlands Single Female Poverty Correlation Chart
The statistical analysis conducted on geographies consisting of 553,969,430 people shows a substantial positive correlation between the proportion of Italians and poverty level among single females in the United States with a correlation coefficient (R) of 0.544 and weighted average of 19.6%. Similarly, the statistical analysis conducted on geographies consisting of 234,903,097 people shows a poor positive correlation between the proportion of Immigrants from Netherlands and poverty level among single females in the United States with a correlation coefficient (R) of 0.151 and weighted average of 20.0%, a difference of 2.0%.
Single Female Poverty Correlation Summary
| Measurement | Italian | Immigrants from Netherlands |
| Minimum | 2.0% | 3.8% |
| Maximum | 100.0% | 60.0% |
| Range | 98.0% | 56.2% |
| Mean | 22.4% | 23.4% |
| Median | 17.3% | 19.7% |
| Interquartile 25% (IQ1) | 11.8% | 16.7% |
| Interquartile 75% (IQ3) | 20.4% | 27.0% |
| Interquartile Range (IQR) | 8.6% | 10.4% |
| Standard Deviation (Sample) | 21.4% | 13.6% |
| Standard Deviation (Population) | 21.3% | 13.4% |
Demographics Similar to Italians and Immigrants from Netherlands by Single Female Poverty
In terms of single female poverty, the demographic groups most similar to Italians are Immigrants from Austria (19.6%, a difference of 0.010%), Romanian (19.6%, a difference of 0.23%), Estonian (19.7%, a difference of 0.61%), Immigrants from Brazil (19.7%, a difference of 0.66%), and Croatian (19.7%, a difference of 0.74%). Similarly, the demographic groups most similar to Immigrants from Netherlands are Carpatho Rusyn (20.0%, a difference of 0.060%), Immigrants from Western Asia (19.9%, a difference of 0.24%), Native Hawaiian (19.9%, a difference of 0.26%), Colombian (19.9%, a difference of 0.26%), and Immigrants from Syria (19.9%, a difference of 0.31%).
| Demographics | Rating | Rank | Single Female Poverty |
| Italians | 98.8 /100 | #92 | Exceptional 19.6% |
| Immigrants | Austria | 98.8 /100 | #93 | Exceptional 19.6% |
| Romanians | 98.6 /100 | #94 | Exceptional 19.6% |
| Estonians | 98.2 /100 | #95 | Exceptional 19.7% |
| Immigrants | Brazil | 98.2 /100 | #96 | Exceptional 19.7% |
| Croatians | 98.1 /100 | #97 | Exceptional 19.7% |
| Immigrants | France | 97.9 /100 | #98 | Exceptional 19.7% |
| Sierra Leoneans | 97.9 /100 | #99 | Exceptional 19.7% |
| Ukrainians | 97.6 /100 | #100 | Exceptional 19.8% |
| Immigrants | Belgium | 97.3 /100 | #101 | Exceptional 19.8% |
| Immigrants | Cameroon | 97.3 /100 | #102 | Exceptional 19.8% |
| Immigrants | Southern Europe | 97.1 /100 | #103 | Exceptional 19.9% |
| Chileans | 96.9 /100 | #104 | Exceptional 19.9% |
| Israelis | 96.9 /100 | #105 | Exceptional 19.9% |
| Ethiopians | 96.7 /100 | #106 | Exceptional 19.9% |
| Immigrants | Syria | 96.7 /100 | #107 | Exceptional 19.9% |
| Native Hawaiians | 96.6 /100 | #108 | Exceptional 19.9% |
| Colombians | 96.6 /100 | #109 | Exceptional 19.9% |
| Immigrants | Western Asia | 96.5 /100 | #110 | Exceptional 19.9% |
| Carpatho Rusyns | 96.1 /100 | #111 | Exceptional 20.0% |
| Immigrants | Netherlands | 96.0 /100 | #112 | Exceptional 20.0% |