Paraguayan vs Immigrants from Netherlands Single Female Poverty
COMPARE
Paraguayan
Immigrants from Netherlands
Single Female Poverty
Single Female Poverty Comparison
Paraguayans
Immigrants from Netherlands
19.3%
SINGLE FEMALE POVERTY
99.5/ 100
METRIC RATING
69th/ 347
METRIC RANK
20.0%
SINGLE FEMALE POVERTY
96.0/ 100
METRIC RATING
112th/ 347
METRIC RANK
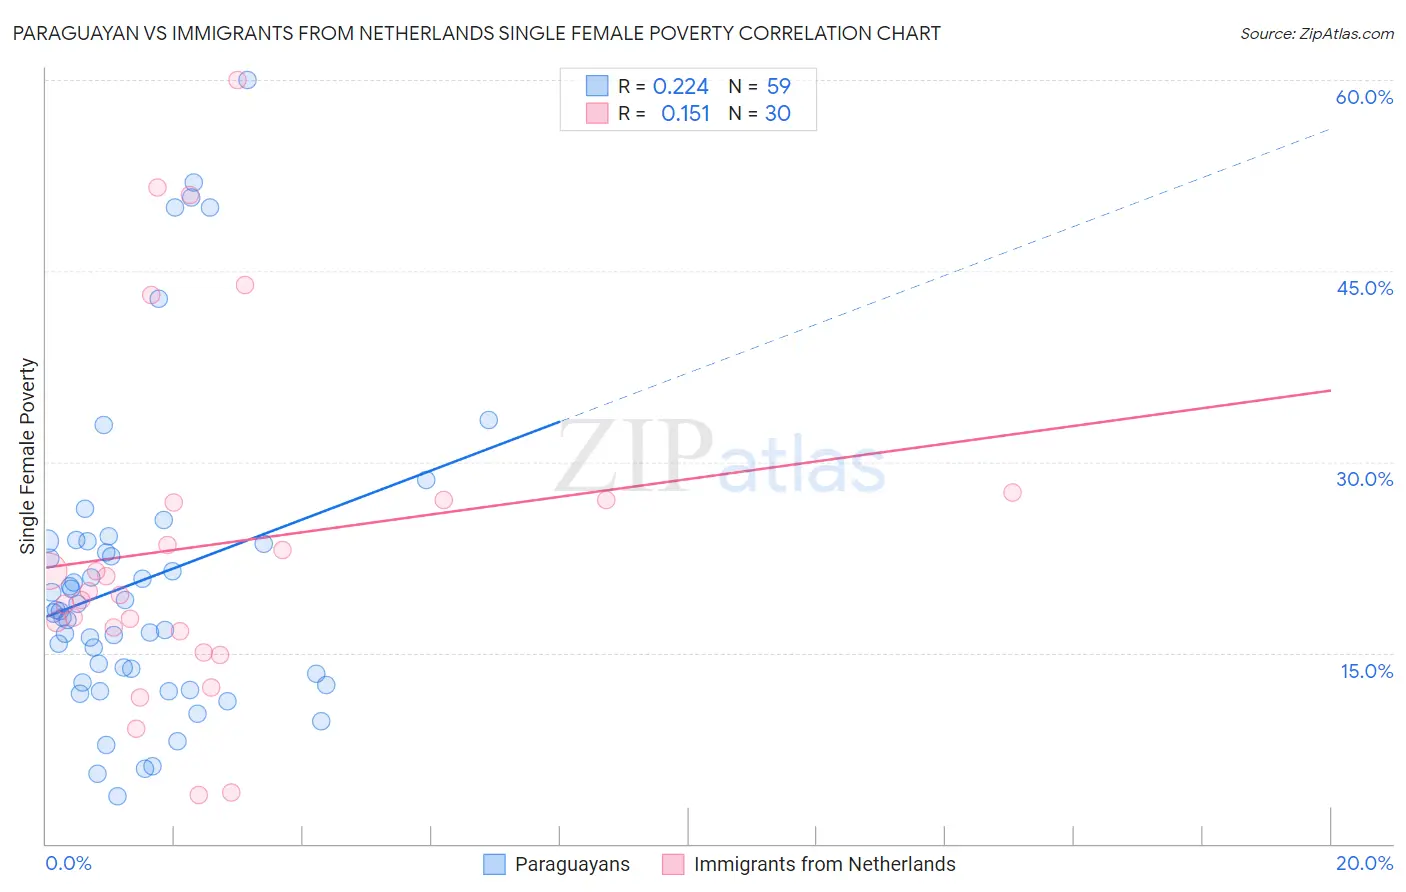
Paraguayan vs Immigrants from Netherlands Single Female Poverty Correlation Chart
The statistical analysis conducted on geographies consisting of 94,675,073 people shows a weak positive correlation between the proportion of Paraguayans and poverty level among single females in the United States with a correlation coefficient (R) of 0.224 and weighted average of 19.3%. Similarly, the statistical analysis conducted on geographies consisting of 234,903,097 people shows a poor positive correlation between the proportion of Immigrants from Netherlands and poverty level among single females in the United States with a correlation coefficient (R) of 0.151 and weighted average of 20.0%, a difference of 3.5%.
Single Female Poverty Correlation Summary
| Measurement | Paraguayan | Immigrants from Netherlands |
| Minimum | 3.7% | 3.8% |
| Maximum | 60.0% | 60.0% |
| Range | 56.3% | 56.2% |
| Mean | 20.7% | 23.4% |
| Median | 18.3% | 19.7% |
| Interquartile 25% (IQ1) | 12.7% | 16.7% |
| Interquartile 75% (IQ3) | 23.7% | 27.0% |
| Interquartile Range (IQR) | 11.0% | 10.4% |
| Standard Deviation (Sample) | 12.1% | 13.6% |
| Standard Deviation (Population) | 12.0% | 13.4% |
Similar Demographics by Single Female Poverty
Demographics Similar to Paraguayans by Single Female Poverty
In terms of single female poverty, the demographic groups most similar to Paraguayans are Immigrants from Jordan (19.3%, a difference of 0.060%), Immigrants from South Eastern Asia (19.3%, a difference of 0.13%), Immigrants from Latvia (19.3%, a difference of 0.14%), Immigrants from Peru (19.3%, a difference of 0.23%), and Laotian (19.3%, a difference of 0.25%).
| Demographics | Rating | Rank | Single Female Poverty |
| Lithuanians | 99.6 /100 | #62 | Exceptional 19.2% |
| Immigrants | Northern Europe | 99.6 /100 | #63 | Exceptional 19.2% |
| Immigrants | Europe | 99.6 /100 | #64 | Exceptional 19.2% |
| Cypriots | 99.6 /100 | #65 | Exceptional 19.2% |
| Palestinians | 99.6 /100 | #66 | Exceptional 19.2% |
| Immigrants | Egypt | 99.6 /100 | #67 | Exceptional 19.2% |
| Laotians | 99.5 /100 | #68 | Exceptional 19.3% |
| Paraguayans | 99.5 /100 | #69 | Exceptional 19.3% |
| Immigrants | Jordan | 99.4 /100 | #70 | Exceptional 19.3% |
| Immigrants | South Eastern Asia | 99.4 /100 | #71 | Exceptional 19.3% |
| Immigrants | Latvia | 99.4 /100 | #72 | Exceptional 19.3% |
| Immigrants | Peru | 99.4 /100 | #73 | Exceptional 19.3% |
| Immigrants | Belarus | 99.4 /100 | #74 | Exceptional 19.3% |
| Immigrants | Turkey | 99.4 /100 | #75 | Exceptional 19.4% |
| Peruvians | 99.4 /100 | #76 | Exceptional 19.4% |
Demographics Similar to Immigrants from Netherlands by Single Female Poverty
In terms of single female poverty, the demographic groups most similar to Immigrants from Netherlands are Immigrants from Zimbabwe (20.0%, a difference of 0.050%), Carpatho Rusyn (20.0%, a difference of 0.060%), Immigrants from Colombia (20.0%, a difference of 0.060%), Immigrants from Northern Africa (20.0%, a difference of 0.070%), and Immigrants from Kazakhstan (20.0%, a difference of 0.11%).
| Demographics | Rating | Rank | Single Female Poverty |
| Israelis | 96.9 /100 | #105 | Exceptional 19.9% |
| Ethiopians | 96.7 /100 | #106 | Exceptional 19.9% |
| Immigrants | Syria | 96.7 /100 | #107 | Exceptional 19.9% |
| Native Hawaiians | 96.6 /100 | #108 | Exceptional 19.9% |
| Colombians | 96.6 /100 | #109 | Exceptional 19.9% |
| Immigrants | Western Asia | 96.5 /100 | #110 | Exceptional 19.9% |
| Carpatho Rusyns | 96.1 /100 | #111 | Exceptional 20.0% |
| Immigrants | Netherlands | 96.0 /100 | #112 | Exceptional 20.0% |
| Immigrants | Zimbabwe | 95.9 /100 | #113 | Exceptional 20.0% |
| Immigrants | Colombia | 95.9 /100 | #114 | Exceptional 20.0% |
| Immigrants | Northern Africa | 95.8 /100 | #115 | Exceptional 20.0% |
| Immigrants | Kazakhstan | 95.7 /100 | #116 | Exceptional 20.0% |
| Poles | 95.6 /100 | #117 | Exceptional 20.0% |
| Immigrants | Afghanistan | 95.4 /100 | #118 | Exceptional 20.0% |
| Immigrants | Ethiopia | 95.4 /100 | #119 | Exceptional 20.0% |