Black/African American vs Immigrants from Canada Single Female Poverty
COMPARE
Black/African American
Immigrants from Canada
Single Female Poverty
Single Female Poverty Comparison
Blacks/African Americans
Immigrants from Canada
26.4%
SINGLE FEMALE POVERTY
0.0/ 100
METRIC RATING
319th/ 347
METRIC RANK
20.2%
SINGLE FEMALE POVERTY
91.2/ 100
METRIC RATING
136th/ 347
METRIC RANK
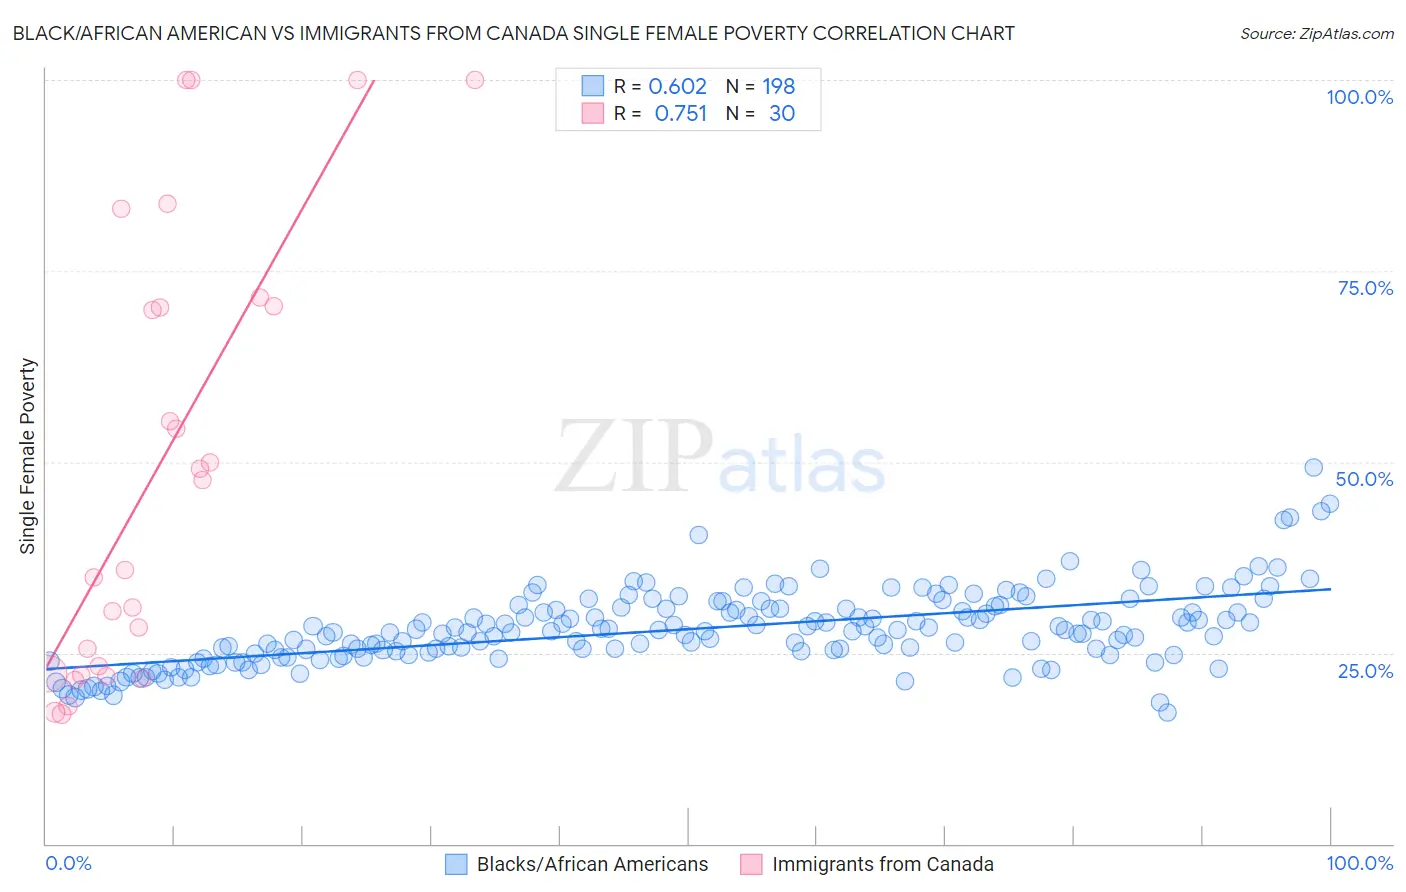
Black/African American vs Immigrants from Canada Single Female Poverty Correlation Chart
The statistical analysis conducted on geographies consisting of 548,844,425 people shows a significant positive correlation between the proportion of Blacks/African Americans and poverty level among single females in the United States with a correlation coefficient (R) of 0.602 and weighted average of 26.4%. Similarly, the statistical analysis conducted on geographies consisting of 448,621,148 people shows a strong positive correlation between the proportion of Immigrants from Canada and poverty level among single females in the United States with a correlation coefficient (R) of 0.751 and weighted average of 20.2%, a difference of 30.2%.
Single Female Poverty Correlation Summary
| Measurement | Black/African American | Immigrants from Canada |
| Minimum | 17.1% | 17.0% |
| Maximum | 49.3% | 100.0% |
| Range | 32.1% | 83.0% |
| Mean | 28.1% | 49.2% |
| Median | 27.8% | 41.8% |
| Interquartile 25% (IQ1) | 24.8% | 22.2% |
| Interquartile 75% (IQ3) | 30.8% | 70.4% |
| Interquartile Range (IQR) | 6.0% | 48.2% |
| Standard Deviation (Sample) | 5.0% | 28.8% |
| Standard Deviation (Population) | 5.0% | 28.3% |
Similar Demographics by Single Female Poverty
Demographics Similar to Blacks/African Americans by Single Female Poverty
In terms of single female poverty, the demographic groups most similar to Blacks/African Americans are Arapaho (26.4%, a difference of 0.30%), Chickasaw (26.3%, a difference of 0.33%), Yup'ik (26.6%, a difference of 0.95%), Ottawa (26.0%, a difference of 1.4%), and Seminole (26.8%, a difference of 1.7%).
| Demographics | Rating | Rank | Single Female Poverty |
| Paiute | 0.0 /100 | #312 | Tragic 25.5% |
| Comanche | 0.0 /100 | #313 | Tragic 25.6% |
| Cherokee | 0.0 /100 | #314 | Tragic 25.7% |
| Iroquois | 0.0 /100 | #315 | Tragic 25.7% |
| Immigrants | Somalia | 0.0 /100 | #316 | Tragic 25.8% |
| Ottawa | 0.0 /100 | #317 | Tragic 26.0% |
| Chickasaw | 0.0 /100 | #318 | Tragic 26.3% |
| Blacks/African Americans | 0.0 /100 | #319 | Tragic 26.4% |
| Arapaho | 0.0 /100 | #320 | Tragic 26.4% |
| Yup'ik | 0.0 /100 | #321 | Tragic 26.6% |
| Seminole | 0.0 /100 | #322 | Tragic 26.8% |
| Chippewa | 0.0 /100 | #323 | Tragic 26.8% |
| Kiowa | 0.0 /100 | #324 | Tragic 26.9% |
| Choctaw | 0.0 /100 | #325 | Tragic 27.2% |
| Creek | 0.0 /100 | #326 | Tragic 27.4% |
Demographics Similar to Immigrants from Canada by Single Female Poverty
In terms of single female poverty, the demographic groups most similar to Immigrants from Canada are Immigrants from Iraq (20.2%, a difference of 0.010%), Immigrants from Venezuela (20.2%, a difference of 0.060%), Immigrants from Nepal (20.3%, a difference of 0.11%), Slovene (20.3%, a difference of 0.14%), and Immigrants from England (20.2%, a difference of 0.15%).
| Demographics | Rating | Rank | Single Female Poverty |
| Immigrants | Morocco | 92.4 /100 | #129 | Exceptional 20.2% |
| Immigrants | Hungary | 92.3 /100 | #130 | Exceptional 20.2% |
| Pakistanis | 92.1 /100 | #131 | Exceptional 20.2% |
| Uruguayans | 92.1 /100 | #132 | Exceptional 20.2% |
| Immigrants | England | 91.9 /100 | #133 | Exceptional 20.2% |
| Immigrants | Venezuela | 91.5 /100 | #134 | Exceptional 20.2% |
| Immigrants | Iraq | 91.2 /100 | #135 | Exceptional 20.2% |
| Immigrants | Canada | 91.2 /100 | #136 | Exceptional 20.2% |
| Immigrants | Nepal | 90.6 /100 | #137 | Exceptional 20.3% |
| Slovenes | 90.5 /100 | #138 | Exceptional 20.3% |
| Immigrants | Kuwait | 90.4 /100 | #139 | Exceptional 20.3% |
| Syrians | 90.4 /100 | #140 | Exceptional 20.3% |
| Immigrants | North America | 89.5 /100 | #141 | Excellent 20.3% |
| Immigrants | Uganda | 89.1 /100 | #142 | Excellent 20.3% |
| Australians | 88.4 /100 | #143 | Excellent 20.3% |