Jamaican vs Immigrants from Netherlands Single Female Poverty
COMPARE
Jamaican
Immigrants from Netherlands
Single Female Poverty
Single Female Poverty Comparison
Jamaicans
Immigrants from Netherlands
21.6%
SINGLE FEMALE POVERTY
14.0/ 100
METRIC RATING
212th/ 347
METRIC RANK
20.0%
SINGLE FEMALE POVERTY
96.0/ 100
METRIC RATING
112th/ 347
METRIC RANK
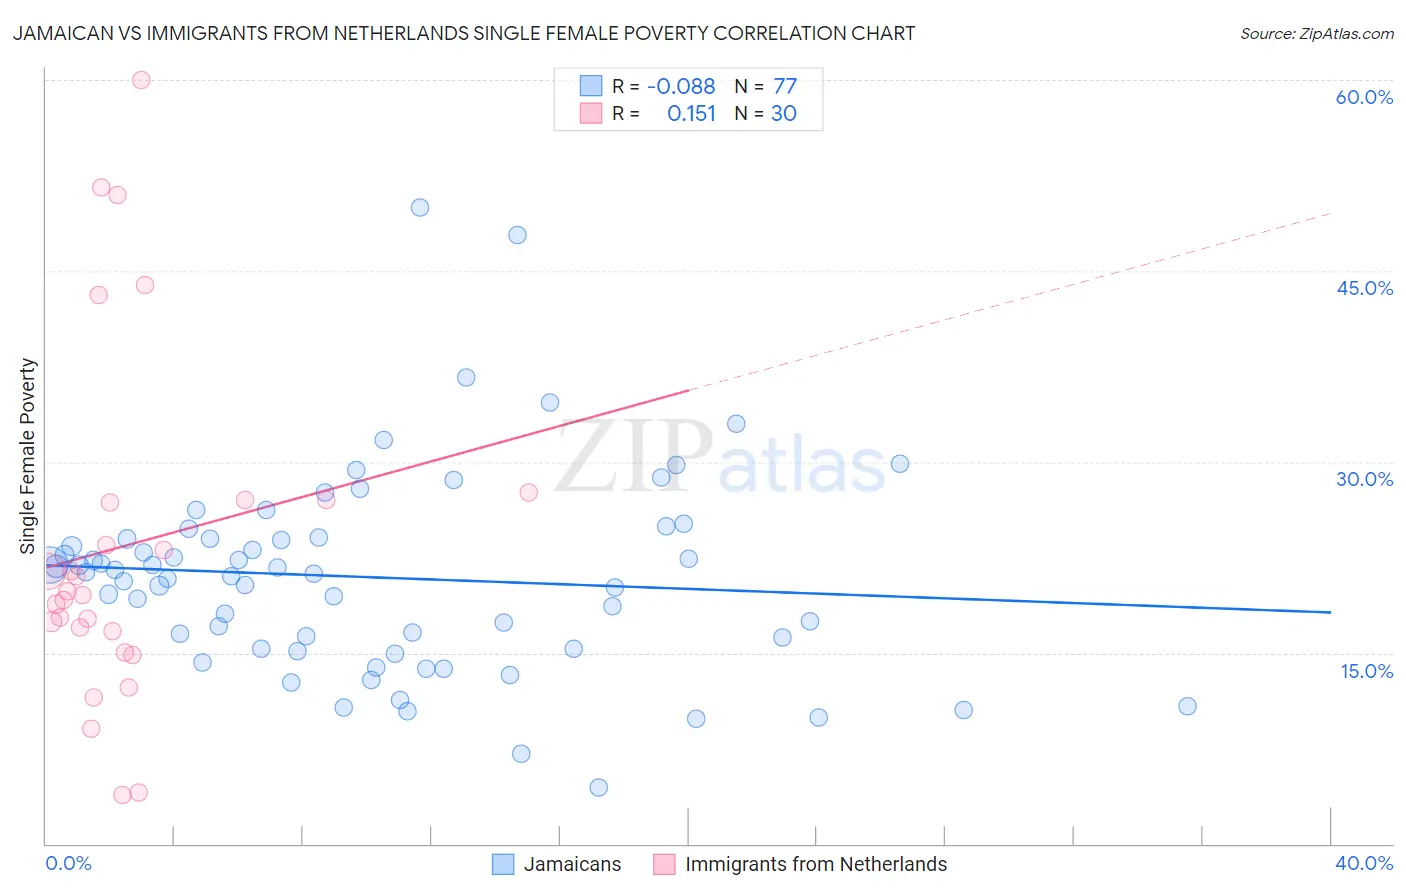
Jamaican vs Immigrants from Netherlands Single Female Poverty Correlation Chart
The statistical analysis conducted on geographies consisting of 363,369,042 people shows a slight negative correlation between the proportion of Jamaicans and poverty level among single females in the United States with a correlation coefficient (R) of -0.088 and weighted average of 21.6%. Similarly, the statistical analysis conducted on geographies consisting of 234,903,097 people shows a poor positive correlation between the proportion of Immigrants from Netherlands and poverty level among single females in the United States with a correlation coefficient (R) of 0.151 and weighted average of 20.0%, a difference of 8.2%.
Single Female Poverty Correlation Summary
| Measurement | Jamaican | Immigrants from Netherlands |
| Minimum | 4.4% | 3.8% |
| Maximum | 50.0% | 60.0% |
| Range | 45.6% | 56.2% |
| Mean | 20.9% | 23.4% |
| Median | 21.2% | 19.7% |
| Interquartile 25% (IQ1) | 15.3% | 16.7% |
| Interquartile 75% (IQ3) | 24.0% | 27.0% |
| Interquartile Range (IQR) | 8.7% | 10.4% |
| Standard Deviation (Sample) | 7.9% | 13.6% |
| Standard Deviation (Population) | 7.9% | 13.4% |
Similar Demographics by Single Female Poverty
Demographics Similar to Jamaicans by Single Female Poverty
In terms of single female poverty, the demographic groups most similar to Jamaicans are Icelander (21.6%, a difference of 0.010%), Guamanian/Chamorro (21.6%, a difference of 0.030%), Immigrants from Panama (21.6%, a difference of 0.050%), Immigrants from Nicaragua (21.6%, a difference of 0.090%), and Immigrants from Eastern Africa (21.6%, a difference of 0.14%).
| Demographics | Rating | Rank | Single Female Poverty |
| Finns | 16.2 /100 | #205 | Poor 21.5% |
| Belgians | 16.1 /100 | #206 | Poor 21.5% |
| Ghanaians | 15.7 /100 | #207 | Poor 21.6% |
| Haitians | 15.4 /100 | #208 | Poor 21.6% |
| Immigrants | Eastern Africa | 15.1 /100 | #209 | Poor 21.6% |
| Immigrants | Panama | 14.4 /100 | #210 | Poor 21.6% |
| Icelanders | 14.0 /100 | #211 | Poor 21.6% |
| Jamaicans | 14.0 /100 | #212 | Poor 21.6% |
| Guamanians/Chamorros | 13.7 /100 | #213 | Poor 21.6% |
| Immigrants | Nicaragua | 13.3 /100 | #214 | Poor 21.6% |
| Ecuadorians | 12.3 /100 | #215 | Poor 21.6% |
| Immigrants | Barbados | 12.2 /100 | #216 | Poor 21.7% |
| Immigrants | St. Vincent and the Grenadines | 11.7 /100 | #217 | Poor 21.7% |
| Nepalese | 9.7 /100 | #218 | Tragic 21.7% |
| Panamanians | 9.4 /100 | #219 | Tragic 21.7% |
Demographics Similar to Immigrants from Netherlands by Single Female Poverty
In terms of single female poverty, the demographic groups most similar to Immigrants from Netherlands are Immigrants from Zimbabwe (20.0%, a difference of 0.050%), Carpatho Rusyn (20.0%, a difference of 0.060%), Immigrants from Colombia (20.0%, a difference of 0.060%), Immigrants from Northern Africa (20.0%, a difference of 0.070%), and Immigrants from Kazakhstan (20.0%, a difference of 0.11%).
| Demographics | Rating | Rank | Single Female Poverty |
| Israelis | 96.9 /100 | #105 | Exceptional 19.9% |
| Ethiopians | 96.7 /100 | #106 | Exceptional 19.9% |
| Immigrants | Syria | 96.7 /100 | #107 | Exceptional 19.9% |
| Native Hawaiians | 96.6 /100 | #108 | Exceptional 19.9% |
| Colombians | 96.6 /100 | #109 | Exceptional 19.9% |
| Immigrants | Western Asia | 96.5 /100 | #110 | Exceptional 19.9% |
| Carpatho Rusyns | 96.1 /100 | #111 | Exceptional 20.0% |
| Immigrants | Netherlands | 96.0 /100 | #112 | Exceptional 20.0% |
| Immigrants | Zimbabwe | 95.9 /100 | #113 | Exceptional 20.0% |
| Immigrants | Colombia | 95.9 /100 | #114 | Exceptional 20.0% |
| Immigrants | Northern Africa | 95.8 /100 | #115 | Exceptional 20.0% |
| Immigrants | Kazakhstan | 95.7 /100 | #116 | Exceptional 20.0% |
| Poles | 95.6 /100 | #117 | Exceptional 20.0% |
| Immigrants | Afghanistan | 95.4 /100 | #118 | Exceptional 20.0% |
| Immigrants | Ethiopia | 95.4 /100 | #119 | Exceptional 20.0% |