Black/African American vs Immigrants from Netherlands Average Family Size
COMPARE
Black/African American
Immigrants from Netherlands
Average Family Size
Average Family Size Comparison
Blacks/African Americans
Immigrants from Netherlands
3.27
AVERAGE FAMILY SIZE
95.7/ 100
METRIC RATING
112th/ 347
METRIC RANK
3.14
AVERAGE FAMILY SIZE
0.3/ 100
METRIC RATING
286th/ 347
METRIC RANK
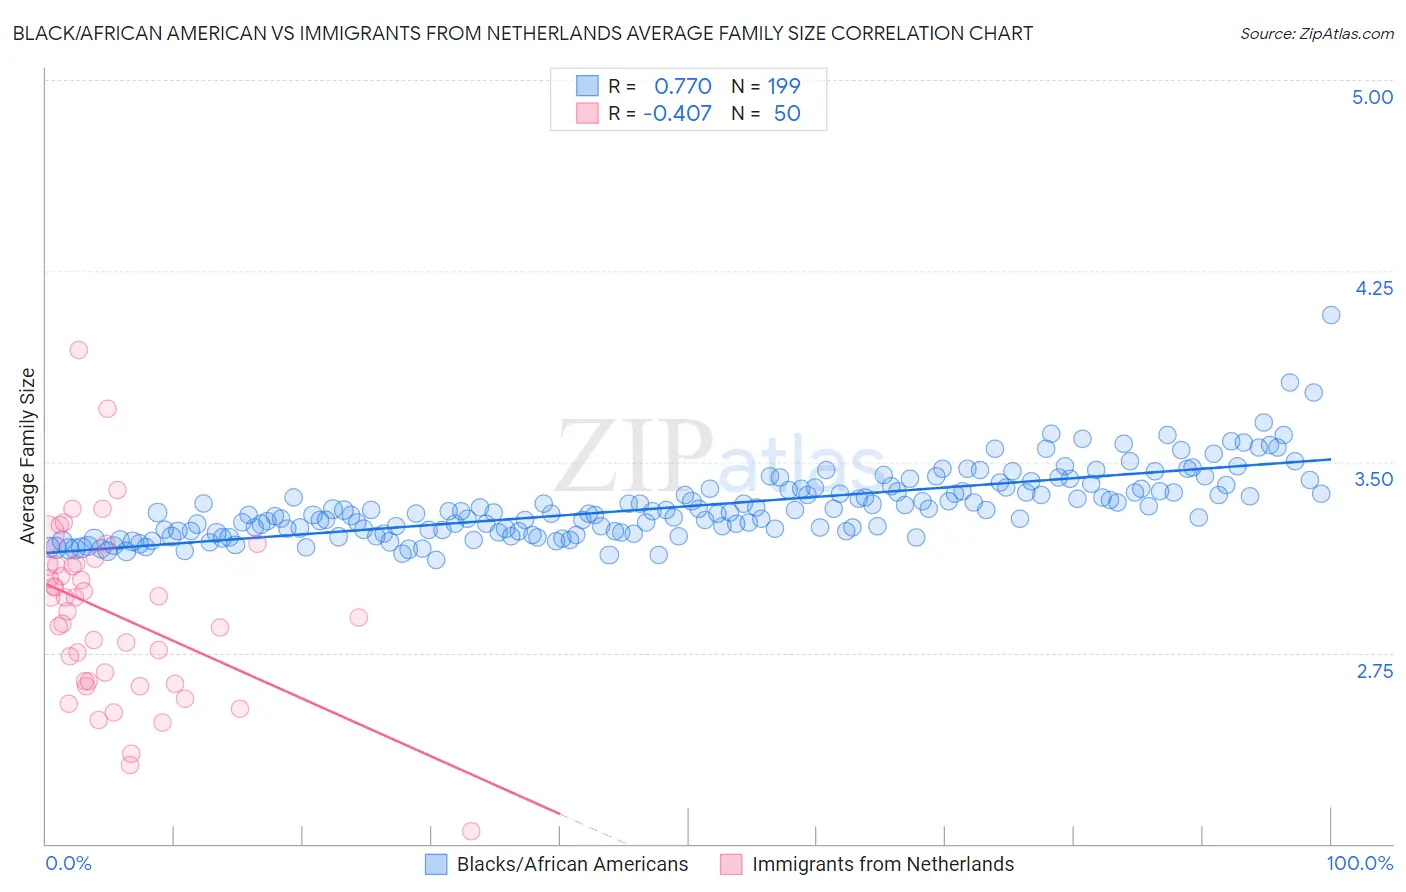
Black/African American vs Immigrants from Netherlands Average Family Size Correlation Chart
The statistical analysis conducted on geographies consisting of 565,344,221 people shows a strong positive correlation between the proportion of Blacks/African Americans and average family size in the United States with a correlation coefficient (R) of 0.770 and weighted average of 3.27. Similarly, the statistical analysis conducted on geographies consisting of 237,802,006 people shows a moderate negative correlation between the proportion of Immigrants from Netherlands and average family size in the United States with a correlation coefficient (R) of -0.407 and weighted average of 3.14, a difference of 4.2%.
Average Family Size Correlation Summary
| Measurement | Black/African American | Immigrants from Netherlands |
| Minimum | 3.12 | 2.05 |
| Maximum | 4.08 | 3.94 |
| Range | 0.96 | 1.89 |
| Mean | 3.33 | 2.90 |
| Median | 3.30 | 2.94 |
| Interquartile 25% (IQ1) | 3.23 | 2.64 |
| Interquartile 75% (IQ3) | 3.39 | 3.09 |
| Interquartile Range (IQR) | 0.16 | 0.46 |
| Standard Deviation (Sample) | 0.14 | 0.35 |
| Standard Deviation (Population) | 0.14 | 0.34 |
Similar Demographics by Average Family Size
Demographics Similar to Blacks/African Americans by Average Family Size
In terms of average family size, the demographic groups most similar to Blacks/African Americans are Immigrants from Panama (3.27, a difference of 0.010%), Indonesian (3.28, a difference of 0.060%), South American (3.27, a difference of 0.060%), Immigrants from Liberia (3.27, a difference of 0.070%), and Immigrants from South America (3.27, a difference of 0.070%).
| Demographics | Rating | Rank | Average Family Size |
| Immigrants | Ghana | 98.1 /100 | #105 | Exceptional 3.29 |
| Paiute | 98.0 /100 | #106 | Exceptional 3.29 |
| Ghanaians | 98.0 /100 | #107 | Exceptional 3.29 |
| Asians | 97.0 /100 | #108 | Exceptional 3.28 |
| Puerto Ricans | 96.7 /100 | #109 | Exceptional 3.28 |
| Bahamians | 96.6 /100 | #110 | Exceptional 3.28 |
| Indonesians | 96.2 /100 | #111 | Exceptional 3.28 |
| Blacks/African Americans | 95.7 /100 | #112 | Exceptional 3.27 |
| Immigrants | Panama | 95.6 /100 | #113 | Exceptional 3.27 |
| South Americans | 95.1 /100 | #114 | Exceptional 3.27 |
| Immigrants | Liberia | 95.0 /100 | #115 | Exceptional 3.27 |
| Immigrants | South America | 95.0 /100 | #116 | Exceptional 3.27 |
| Kiowa | 94.8 /100 | #117 | Exceptional 3.27 |
| Immigrants | Asia | 94.0 /100 | #118 | Exceptional 3.27 |
| Immigrants | Indonesia | 93.7 /100 | #119 | Exceptional 3.27 |
Demographics Similar to Immigrants from Netherlands by Average Family Size
In terms of average family size, the demographic groups most similar to Immigrants from Netherlands are Greek (3.14, a difference of 0.010%), Immigrants from Czechoslovakia (3.14, a difference of 0.010%), Immigrants from Norway (3.14, a difference of 0.010%), Cypriot (3.14, a difference of 0.040%), and White/Caucasian (3.14, a difference of 0.050%).
| Demographics | Rating | Rank | Average Family Size |
| Immigrants | Europe | 0.5 /100 | #279 | Tragic 3.15 |
| Immigrants | England | 0.4 /100 | #280 | Tragic 3.15 |
| Immigrants | Denmark | 0.4 /100 | #281 | Tragic 3.15 |
| Yugoslavians | 0.4 /100 | #282 | Tragic 3.15 |
| German Russians | 0.4 /100 | #283 | Tragic 3.15 |
| Immigrants | France | 0.4 /100 | #284 | Tragic 3.15 |
| Whites/Caucasians | 0.3 /100 | #285 | Tragic 3.14 |
| Immigrants | Netherlands | 0.3 /100 | #286 | Tragic 3.14 |
| Greeks | 0.3 /100 | #287 | Tragic 3.14 |
| Immigrants | Czechoslovakia | 0.3 /100 | #288 | Tragic 3.14 |
| Immigrants | Norway | 0.3 /100 | #289 | Tragic 3.14 |
| Cypriots | 0.3 /100 | #290 | Tragic 3.14 |
| Alsatians | 0.2 /100 | #291 | Tragic 3.14 |
| Europeans | 0.2 /100 | #292 | Tragic 3.14 |
| Scandinavians | 0.2 /100 | #293 | Tragic 3.14 |