Black/African American vs Vietnamese Single Female Poverty
COMPARE
Black/African American
Vietnamese
Single Female Poverty
Single Female Poverty Comparison
Blacks/African Americans
Vietnamese
26.4%
SINGLE FEMALE POVERTY
0.0/ 100
METRIC RATING
319th/ 347
METRIC RANK
22.0%
SINGLE FEMALE POVERTY
4.0/ 100
METRIC RATING
237th/ 347
METRIC RANK
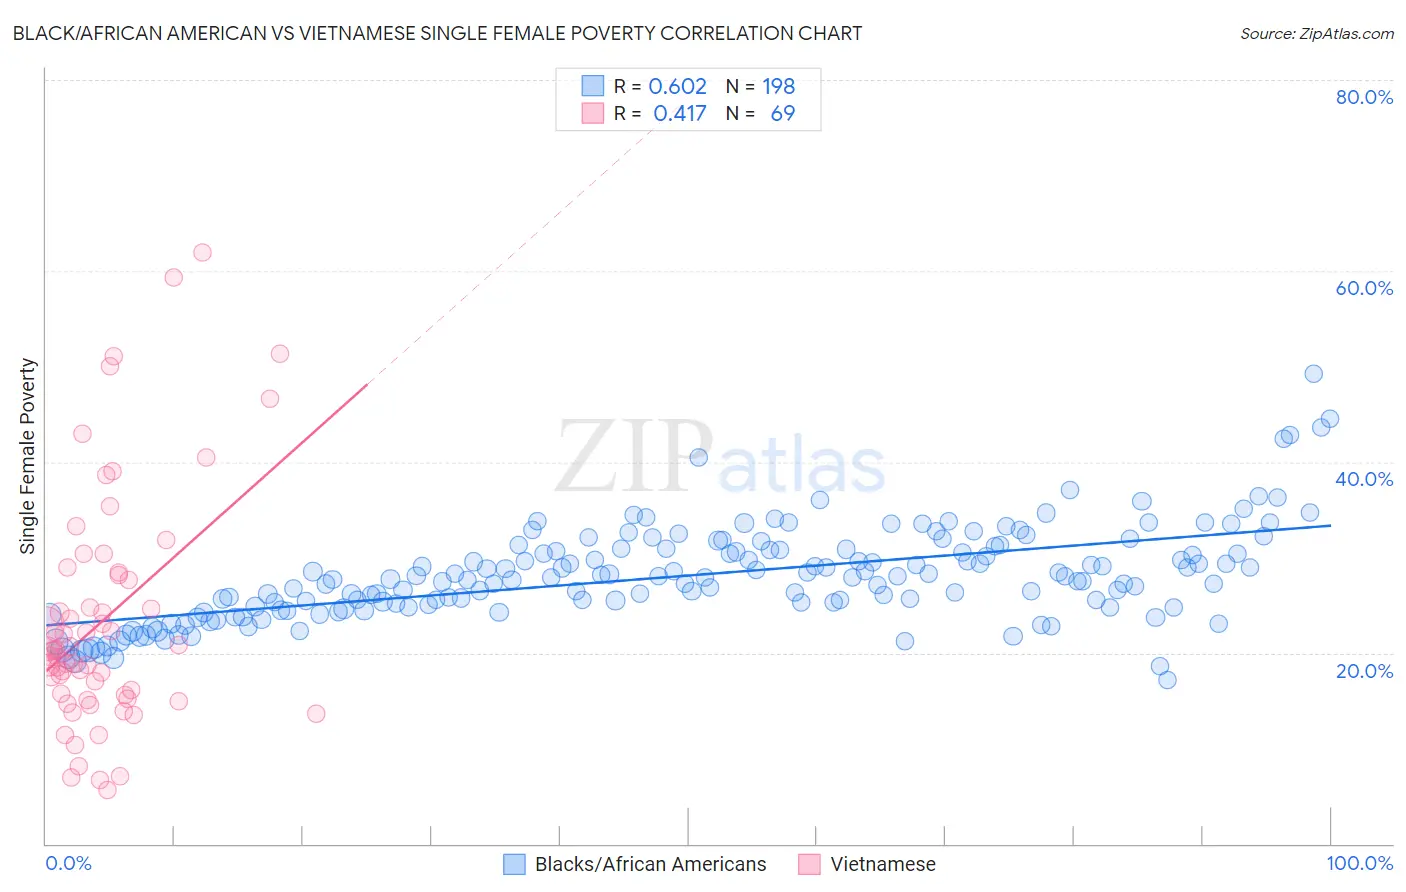
Black/African American vs Vietnamese Single Female Poverty Correlation Chart
The statistical analysis conducted on geographies consisting of 548,844,425 people shows a significant positive correlation between the proportion of Blacks/African Americans and poverty level among single females in the United States with a correlation coefficient (R) of 0.602 and weighted average of 26.4%. Similarly, the statistical analysis conducted on geographies consisting of 169,688,575 people shows a moderate positive correlation between the proportion of Vietnamese and poverty level among single females in the United States with a correlation coefficient (R) of 0.417 and weighted average of 22.0%, a difference of 19.5%.
Single Female Poverty Correlation Summary
| Measurement | Black/African American | Vietnamese |
| Minimum | 17.1% | 5.6% |
| Maximum | 49.3% | 61.9% |
| Range | 32.1% | 56.4% |
| Mean | 28.1% | 23.4% |
| Median | 27.8% | 20.3% |
| Interquartile 25% (IQ1) | 24.8% | 15.4% |
| Interquartile 75% (IQ3) | 30.8% | 28.3% |
| Interquartile Range (IQR) | 6.0% | 12.9% |
| Standard Deviation (Sample) | 5.0% | 12.3% |
| Standard Deviation (Population) | 5.0% | 12.3% |
Similar Demographics by Single Female Poverty
Demographics Similar to Blacks/African Americans by Single Female Poverty
In terms of single female poverty, the demographic groups most similar to Blacks/African Americans are Arapaho (26.4%, a difference of 0.30%), Chickasaw (26.3%, a difference of 0.33%), Yup'ik (26.6%, a difference of 0.95%), Ottawa (26.0%, a difference of 1.4%), and Seminole (26.8%, a difference of 1.7%).
| Demographics | Rating | Rank | Single Female Poverty |
| Paiute | 0.0 /100 | #312 | Tragic 25.5% |
| Comanche | 0.0 /100 | #313 | Tragic 25.6% |
| Cherokee | 0.0 /100 | #314 | Tragic 25.7% |
| Iroquois | 0.0 /100 | #315 | Tragic 25.7% |
| Immigrants | Somalia | 0.0 /100 | #316 | Tragic 25.8% |
| Ottawa | 0.0 /100 | #317 | Tragic 26.0% |
| Chickasaw | 0.0 /100 | #318 | Tragic 26.3% |
| Blacks/African Americans | 0.0 /100 | #319 | Tragic 26.4% |
| Arapaho | 0.0 /100 | #320 | Tragic 26.4% |
| Yup'ik | 0.0 /100 | #321 | Tragic 26.6% |
| Seminole | 0.0 /100 | #322 | Tragic 26.8% |
| Chippewa | 0.0 /100 | #323 | Tragic 26.8% |
| Kiowa | 0.0 /100 | #324 | Tragic 26.9% |
| Choctaw | 0.0 /100 | #325 | Tragic 27.2% |
| Creek | 0.0 /100 | #326 | Tragic 27.4% |
Demographics Similar to Vietnamese by Single Female Poverty
In terms of single female poverty, the demographic groups most similar to Vietnamese are Immigrants from Ecuador (22.0%, a difference of 0.070%), Dutch (22.0%, a difference of 0.23%), Spaniard (22.0%, a difference of 0.25%), Spanish (22.0%, a difference of 0.25%), and Immigrants from Thailand (22.0%, a difference of 0.35%).
| Demographics | Rating | Rank | Single Female Poverty |
| Immigrants | Western Africa | 5.3 /100 | #230 | Tragic 22.0% |
| Welsh | 5.0 /100 | #231 | Tragic 22.0% |
| Immigrants | Thailand | 5.0 /100 | #232 | Tragic 22.0% |
| Spaniards | 4.7 /100 | #233 | Tragic 22.0% |
| Spanish | 4.7 /100 | #234 | Tragic 22.0% |
| Dutch | 4.6 /100 | #235 | Tragic 22.0% |
| Immigrants | Ecuador | 4.2 /100 | #236 | Tragic 22.0% |
| Vietnamese | 4.0 /100 | #237 | Tragic 22.0% |
| French Canadians | 2.8 /100 | #238 | Tragic 22.2% |
| Malaysians | 2.8 /100 | #239 | Tragic 22.2% |
| French | 2.3 /100 | #240 | Tragic 22.2% |
| Cape Verdeans | 2.1 /100 | #241 | Tragic 22.3% |
| Bermudans | 2.0 /100 | #242 | Tragic 22.3% |
| West Indians | 1.9 /100 | #243 | Tragic 22.3% |
| Immigrants | Middle Africa | 1.9 /100 | #244 | Tragic 22.3% |