Bermudan vs Brazilian Median Female Earnings
COMPARE
Bermudan
Brazilian
Median Female Earnings
Median Female Earnings Comparison
Bermudans
Brazilians
$39,418
MEDIAN FEMALE EARNINGS
35.9/ 100
METRIC RATING
188th/ 347
METRIC RANK
$40,483
MEDIAN FEMALE EARNINGS
83.6/ 100
METRIC RATING
145th/ 347
METRIC RANK
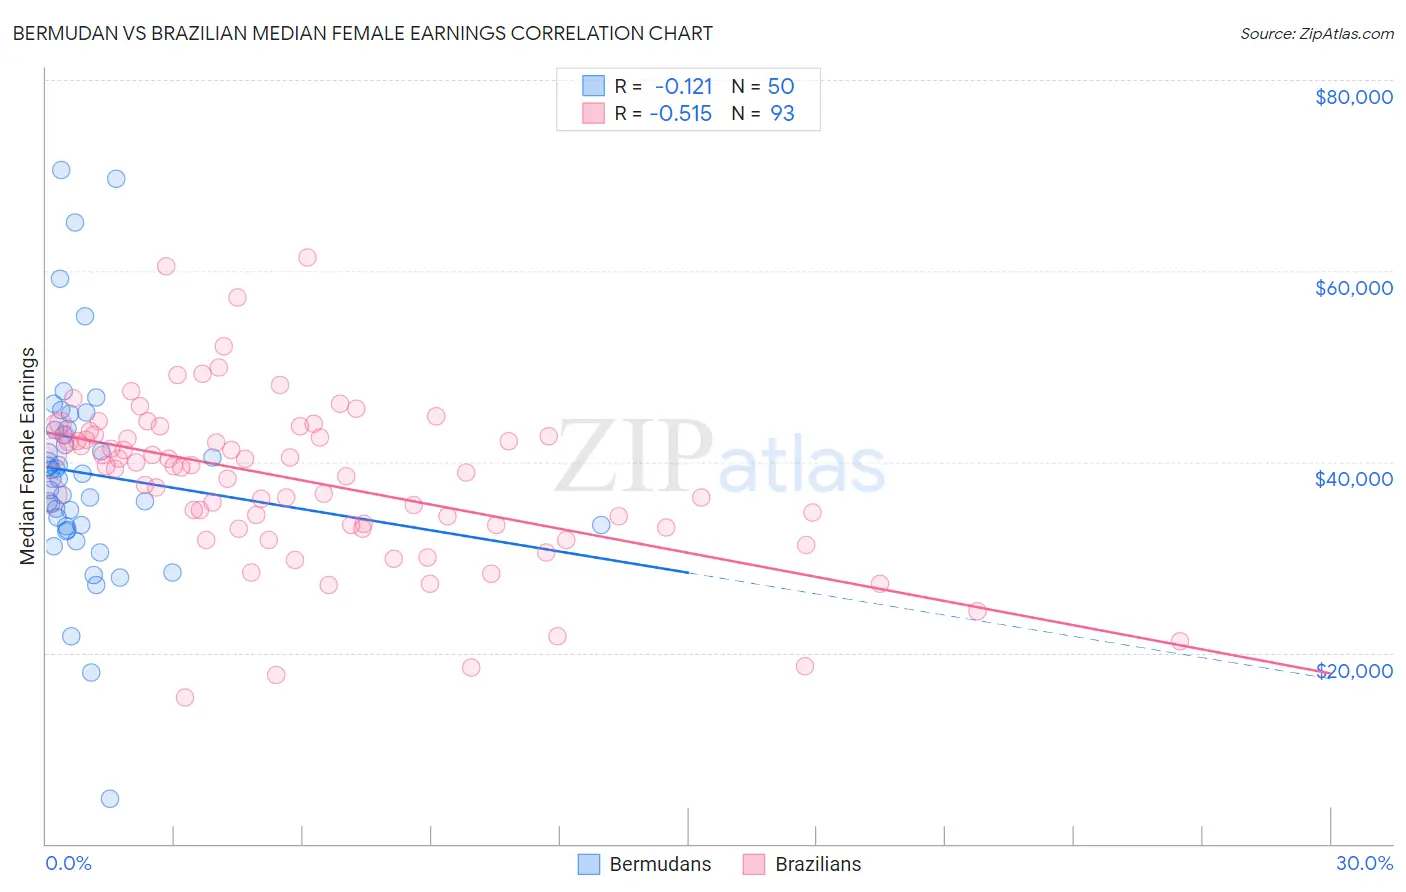
Bermudan vs Brazilian Median Female Earnings Correlation Chart
The statistical analysis conducted on geographies consisting of 55,724,642 people shows a poor negative correlation between the proportion of Bermudans and median female earnings in the United States with a correlation coefficient (R) of -0.121 and weighted average of $39,418. Similarly, the statistical analysis conducted on geographies consisting of 323,890,405 people shows a substantial negative correlation between the proportion of Brazilians and median female earnings in the United States with a correlation coefficient (R) of -0.515 and weighted average of $40,483, a difference of 2.7%.
Median Female Earnings Correlation Summary
| Measurement | Bermudan | Brazilian |
| Minimum | $4,682 | $15,384 |
| Maximum | $70,590 | $61,398 |
| Range | $65,908 | $46,014 |
| Mean | $38,764 | $38,053 |
| Median | $38,256 | $39,528 |
| Interquartile 25% (IQ1) | $33,240 | $33,268 |
| Interquartile 75% (IQ3) | $43,282 | $42,843 |
| Interquartile Range (IQR) | $10,042 | $9,575 |
| Standard Deviation (Sample) | $11,556 | $8,528 |
| Standard Deviation (Population) | $11,440 | $8,482 |
Similar Demographics by Median Female Earnings
Demographics Similar to Bermudans by Median Female Earnings
In terms of median female earnings, the demographic groups most similar to Bermudans are Swedish ($39,421, a difference of 0.010%), Colombian ($39,439, a difference of 0.050%), Immigrants from West Indies ($39,441, a difference of 0.060%), Senegalese ($39,384, a difference of 0.090%), and European ($39,457, a difference of 0.10%).
| Demographics | Rating | Rank | Median Female Earnings |
| Tsimshian | 41.4 /100 | #181 | Average $39,530 |
| Tlingit-Haida | 40.5 /100 | #182 | Average $39,513 |
| Hungarians | 40.3 /100 | #183 | Average $39,510 |
| Europeans | 37.7 /100 | #184 | Fair $39,457 |
| Immigrants | West Indies | 36.9 /100 | #185 | Fair $39,441 |
| Colombians | 36.9 /100 | #186 | Fair $39,439 |
| Swedes | 36.0 /100 | #187 | Fair $39,421 |
| Bermudans | 35.9 /100 | #188 | Fair $39,418 |
| Senegalese | 34.2 /100 | #189 | Fair $39,384 |
| Puget Sound Salish | 33.9 /100 | #190 | Fair $39,376 |
| Immigrants | Western Africa | 32.7 /100 | #191 | Fair $39,351 |
| Immigrants | Immigrants | 31.7 /100 | #192 | Fair $39,328 |
| Immigrants | Nigeria | 30.2 /100 | #193 | Fair $39,294 |
| Irish | 30.0 /100 | #194 | Fair $39,291 |
| Uruguayans | 27.3 /100 | #195 | Fair $39,228 |
Demographics Similar to Brazilians by Median Female Earnings
In terms of median female earnings, the demographic groups most similar to Brazilians are Immigrants from North Macedonia ($40,488, a difference of 0.010%), Northern European ($40,491, a difference of 0.020%), Sri Lankan ($40,496, a difference of 0.030%), Immigrants from Syria ($40,499, a difference of 0.040%), and Ghanaian ($40,429, a difference of 0.13%).
| Demographics | Rating | Rank | Median Female Earnings |
| Taiwanese | 86.1 /100 | #138 | Excellent $40,576 |
| Immigrants | South Eastern Asia | 85.7 /100 | #139 | Excellent $40,558 |
| Serbians | 85.2 /100 | #140 | Excellent $40,539 |
| Immigrants | Syria | 84.1 /100 | #141 | Excellent $40,499 |
| Sri Lankans | 84.0 /100 | #142 | Excellent $40,496 |
| Northern Europeans | 83.9 /100 | #143 | Excellent $40,491 |
| Immigrants | North Macedonia | 83.8 /100 | #144 | Excellent $40,488 |
| Brazilians | 83.6 /100 | #145 | Excellent $40,483 |
| Ghanaians | 82.1 /100 | #146 | Excellent $40,429 |
| Vietnamese | 80.4 /100 | #147 | Excellent $40,377 |
| Poles | 80.2 /100 | #148 | Excellent $40,371 |
| Immigrants | Cameroon | 79.7 /100 | #149 | Good $40,354 |
| Immigrants | Chile | 79.6 /100 | #150 | Good $40,353 |
| Immigrants | Armenia | 79.2 /100 | #151 | Good $40,340 |
| West Indians | 78.4 /100 | #152 | Good $40,317 |