Bangladeshi vs Immigrants from Vietnam Family Poverty
COMPARE
Bangladeshi
Immigrants from Vietnam
Family Poverty
Family Poverty Comparison
Bangladeshis
Immigrants from Vietnam
10.9%
FAMILY POVERTY
0.2/ 100
METRIC RATING
260th/ 347
METRIC RANK
8.7%
FAMILY POVERTY
75.4/ 100
METRIC RATING
154th/ 347
METRIC RANK
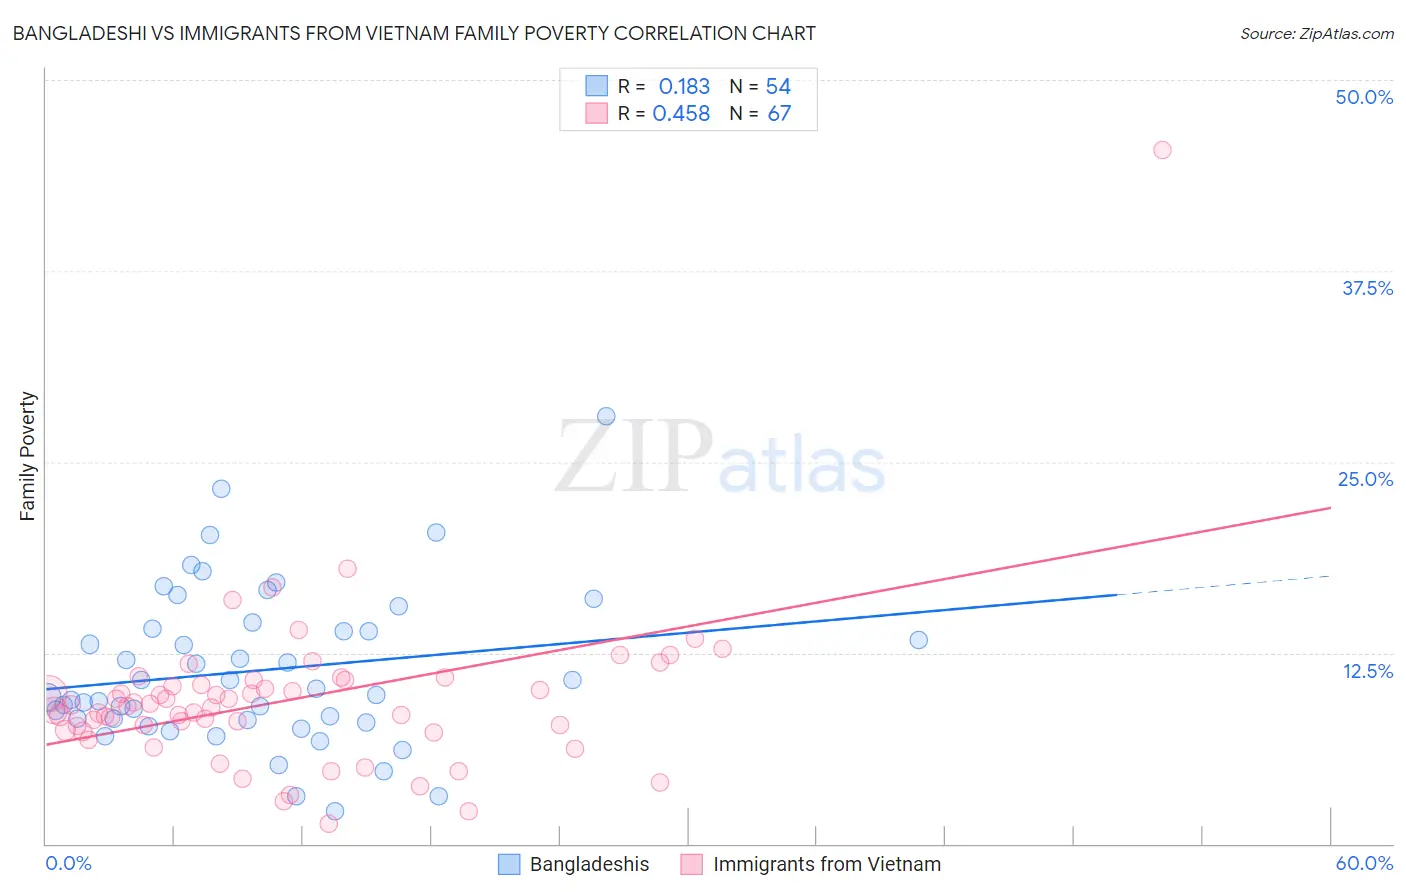
Bangladeshi vs Immigrants from Vietnam Family Poverty Correlation Chart
The statistical analysis conducted on geographies consisting of 141,248,982 people shows a poor positive correlation between the proportion of Bangladeshis and poverty level among families in the United States with a correlation coefficient (R) of 0.183 and weighted average of 10.9%. Similarly, the statistical analysis conducted on geographies consisting of 403,957,519 people shows a moderate positive correlation between the proportion of Immigrants from Vietnam and poverty level among families in the United States with a correlation coefficient (R) of 0.458 and weighted average of 8.7%, a difference of 25.6%.
Family Poverty Correlation Summary
| Measurement | Bangladeshi | Immigrants from Vietnam |
| Minimum | 2.1% | 1.3% |
| Maximum | 28.0% | 45.5% |
| Range | 25.9% | 44.1% |
| Mean | 11.3% | 9.4% |
| Median | 9.9% | 9.0% |
| Interquartile 25% (IQ1) | 8.1% | 7.4% |
| Interquartile 75% (IQ3) | 14.1% | 10.7% |
| Interquartile Range (IQR) | 6.0% | 3.3% |
| Standard Deviation (Sample) | 5.1% | 5.5% |
| Standard Deviation (Population) | 5.1% | 5.5% |
Similar Demographics by Family Poverty
Demographics Similar to Bangladeshis by Family Poverty
In terms of family poverty, the demographic groups most similar to Bangladeshis are Shoshone (10.9%, a difference of 0.030%), Spanish American Indian (10.9%, a difference of 0.17%), Mexican American Indian (10.9%, a difference of 0.35%), Subsaharan African (10.9%, a difference of 0.39%), and Immigrants from Ghana (10.8%, a difference of 0.42%).
| Demographics | Rating | Rank | Family Poverty |
| Immigrants | Western Africa | 0.3 /100 | #253 | Tragic 10.7% |
| Ecuadorians | 0.2 /100 | #254 | Tragic 10.8% |
| Immigrants | Liberia | 0.2 /100 | #255 | Tragic 10.8% |
| Chickasaw | 0.2 /100 | #256 | Tragic 10.8% |
| Immigrants | Ghana | 0.2 /100 | #257 | Tragic 10.8% |
| Sub-Saharan Africans | 0.2 /100 | #258 | Tragic 10.9% |
| Mexican American Indians | 0.2 /100 | #259 | Tragic 10.9% |
| Bangladeshis | 0.2 /100 | #260 | Tragic 10.9% |
| Shoshone | 0.2 /100 | #261 | Tragic 10.9% |
| Spanish American Indians | 0.2 /100 | #262 | Tragic 10.9% |
| Cape Verdeans | 0.1 /100 | #263 | Tragic 10.9% |
| Trinidadians and Tobagonians | 0.1 /100 | #264 | Tragic 10.9% |
| Immigrants | Trinidad and Tobago | 0.1 /100 | #265 | Tragic 10.9% |
| Immigrants | El Salvador | 0.1 /100 | #266 | Tragic 11.0% |
| Comanche | 0.1 /100 | #267 | Tragic 11.0% |
Demographics Similar to Immigrants from Vietnam by Family Poverty
In terms of family poverty, the demographic groups most similar to Immigrants from Vietnam are Immigrants from Kuwait (8.7%, a difference of 0.33%), Immigrants from Spain (8.6%, a difference of 0.72%), Immigrants from Oceania (8.7%, a difference of 0.74%), Samoan (8.6%, a difference of 0.86%), and Brazilian (8.6%, a difference of 0.94%).
| Demographics | Rating | Rank | Family Poverty |
| Immigrants | Jordan | 83.0 /100 | #147 | Excellent 8.5% |
| Scotch-Irish | 82.2 /100 | #148 | Excellent 8.6% |
| Mongolians | 80.4 /100 | #149 | Excellent 8.6% |
| Syrians | 80.3 /100 | #150 | Excellent 8.6% |
| Brazilians | 80.1 /100 | #151 | Excellent 8.6% |
| Samoans | 79.8 /100 | #152 | Good 8.6% |
| Immigrants | Spain | 79.1 /100 | #153 | Good 8.6% |
| Immigrants | Vietnam | 75.4 /100 | #154 | Good 8.7% |
| Immigrants | Kuwait | 73.6 /100 | #155 | Good 8.7% |
| Immigrants | Oceania | 71.2 /100 | #156 | Good 8.7% |
| Tsimshian | 69.3 /100 | #157 | Good 8.8% |
| Whites/Caucasians | 69.1 /100 | #158 | Good 8.8% |
| Peruvians | 68.0 /100 | #159 | Good 8.8% |
| Hungarians | 67.2 /100 | #160 | Good 8.8% |
| Immigrants | Northern Africa | 66.9 /100 | #161 | Good 8.8% |