Chinese vs Immigrants from Vietnam Family Poverty
COMPARE
Chinese
Immigrants from Vietnam
Family Poverty
Family Poverty Comparison
Chinese
Immigrants from Vietnam
6.5%
FAMILY POVERTY
100.0/ 100
METRIC RATING
2nd/ 347
METRIC RANK
8.7%
FAMILY POVERTY
75.4/ 100
METRIC RATING
154th/ 347
METRIC RANK
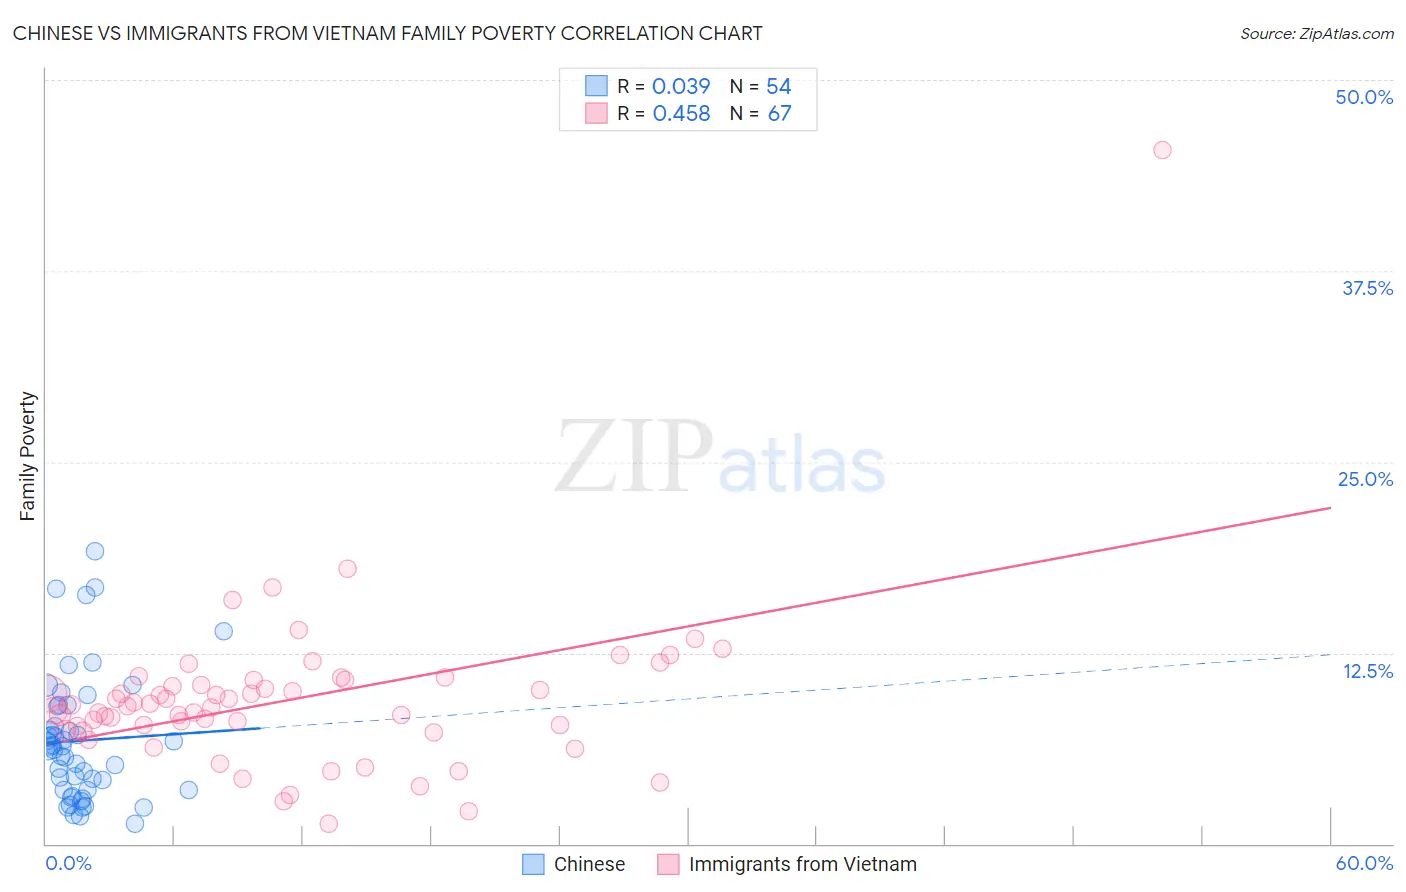
Chinese vs Immigrants from Vietnam Family Poverty Correlation Chart
The statistical analysis conducted on geographies consisting of 64,784,795 people shows no correlation between the proportion of Chinese and poverty level among families in the United States with a correlation coefficient (R) of 0.039 and weighted average of 6.5%. Similarly, the statistical analysis conducted on geographies consisting of 403,957,519 people shows a moderate positive correlation between the proportion of Immigrants from Vietnam and poverty level among families in the United States with a correlation coefficient (R) of 0.458 and weighted average of 8.7%, a difference of 33.3%.
Family Poverty Correlation Summary
| Measurement | Chinese | Immigrants from Vietnam |
| Minimum | 1.3% | 1.3% |
| Maximum | 19.1% | 45.5% |
| Range | 17.8% | 44.1% |
| Mean | 6.8% | 9.4% |
| Median | 6.3% | 9.0% |
| Interquartile 25% (IQ1) | 3.5% | 7.4% |
| Interquartile 75% (IQ3) | 9.0% | 10.7% |
| Interquartile Range (IQR) | 5.5% | 3.3% |
| Standard Deviation (Sample) | 4.1% | 5.5% |
| Standard Deviation (Population) | 4.1% | 5.5% |
Similar Demographics by Family Poverty
Demographics Similar to Chinese by Family Poverty
In terms of family poverty, the demographic groups most similar to Chinese are Immigrants from Taiwan (6.6%, a difference of 1.6%), Filipino (6.6%, a difference of 2.2%), Thai (6.7%, a difference of 2.8%), Immigrants from India (6.2%, a difference of 4.3%), and Norwegian (6.9%, a difference of 5.9%).
| Demographics | Rating | Rank | Family Poverty |
| Immigrants | India | 100.0 /100 | #1 | Exceptional 6.2% |
| Chinese | 100.0 /100 | #2 | Exceptional 6.5% |
| Immigrants | Taiwan | 100.0 /100 | #3 | Exceptional 6.6% |
| Filipinos | 100.0 /100 | #4 | Exceptional 6.6% |
| Thais | 100.0 /100 | #5 | Exceptional 6.7% |
| Norwegians | 99.9 /100 | #6 | Exceptional 6.9% |
| Immigrants | Ireland | 99.9 /100 | #7 | Exceptional 7.0% |
| Bhutanese | 99.9 /100 | #8 | Exceptional 7.0% |
| Latvians | 99.9 /100 | #9 | Exceptional 7.1% |
| Bulgarians | 99.8 /100 | #10 | Exceptional 7.1% |
| Immigrants | Singapore | 99.8 /100 | #11 | Exceptional 7.1% |
| Maltese | 99.8 /100 | #12 | Exceptional 7.1% |
| Swedes | 99.8 /100 | #13 | Exceptional 7.1% |
| Iranians | 99.8 /100 | #14 | Exceptional 7.1% |
| Lithuanians | 99.8 /100 | #15 | Exceptional 7.2% |
Demographics Similar to Immigrants from Vietnam by Family Poverty
In terms of family poverty, the demographic groups most similar to Immigrants from Vietnam are Immigrants from Kuwait (8.7%, a difference of 0.33%), Immigrants from Spain (8.6%, a difference of 0.72%), Immigrants from Oceania (8.7%, a difference of 0.74%), Samoan (8.6%, a difference of 0.86%), and Brazilian (8.6%, a difference of 0.94%).
| Demographics | Rating | Rank | Family Poverty |
| Immigrants | Jordan | 83.0 /100 | #147 | Excellent 8.5% |
| Scotch-Irish | 82.2 /100 | #148 | Excellent 8.6% |
| Mongolians | 80.4 /100 | #149 | Excellent 8.6% |
| Syrians | 80.3 /100 | #150 | Excellent 8.6% |
| Brazilians | 80.1 /100 | #151 | Excellent 8.6% |
| Samoans | 79.8 /100 | #152 | Good 8.6% |
| Immigrants | Spain | 79.1 /100 | #153 | Good 8.6% |
| Immigrants | Vietnam | 75.4 /100 | #154 | Good 8.7% |
| Immigrants | Kuwait | 73.6 /100 | #155 | Good 8.7% |
| Immigrants | Oceania | 71.2 /100 | #156 | Good 8.7% |
| Tsimshian | 69.3 /100 | #157 | Good 8.8% |
| Whites/Caucasians | 69.1 /100 | #158 | Good 8.8% |
| Peruvians | 68.0 /100 | #159 | Good 8.8% |
| Hungarians | 67.2 /100 | #160 | Good 8.8% |
| Immigrants | Northern Africa | 66.9 /100 | #161 | Good 8.8% |