Tohono O'odham vs Immigrants from Vietnam Family Poverty
COMPARE
Tohono O'odham
Immigrants from Vietnam
Family Poverty
Family Poverty Comparison
Tohono O'odham
Immigrants from Vietnam
20.4%
FAMILY POVERTY
0.0/ 100
METRIC RATING
347th/ 347
METRIC RANK
8.7%
FAMILY POVERTY
75.4/ 100
METRIC RATING
154th/ 347
METRIC RANK
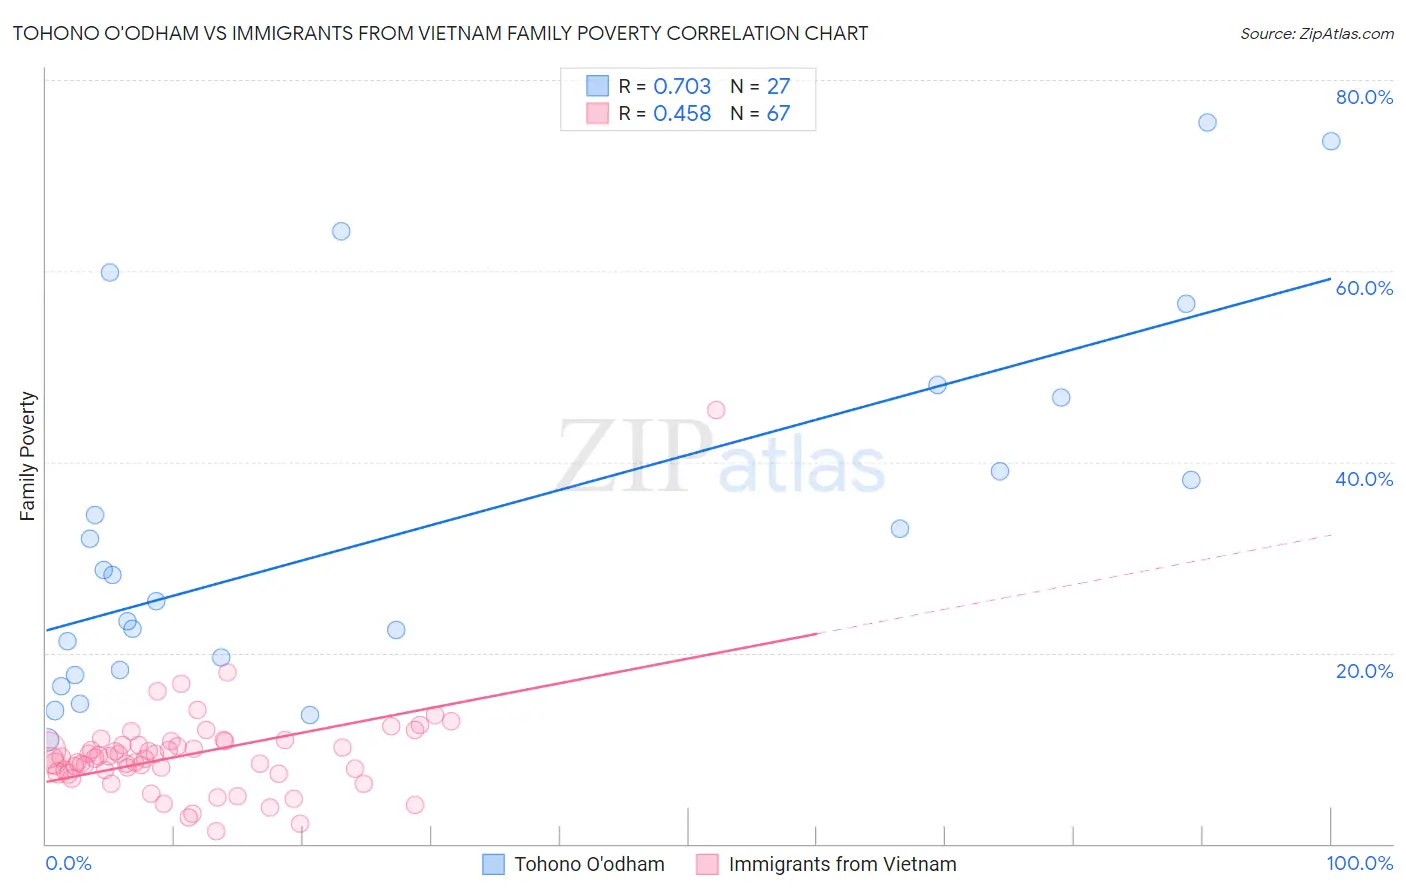
Tohono O'odham vs Immigrants from Vietnam Family Poverty Correlation Chart
The statistical analysis conducted on geographies consisting of 58,710,760 people shows a strong positive correlation between the proportion of Tohono O'odham and poverty level among families in the United States with a correlation coefficient (R) of 0.703 and weighted average of 20.4%. Similarly, the statistical analysis conducted on geographies consisting of 403,957,519 people shows a moderate positive correlation between the proportion of Immigrants from Vietnam and poverty level among families in the United States with a correlation coefficient (R) of 0.458 and weighted average of 8.7%, a difference of 135.1%.
Family Poverty Correlation Summary
| Measurement | Tohono O'odham | Immigrants from Vietnam |
| Minimum | 10.9% | 1.3% |
| Maximum | 75.6% | 45.5% |
| Range | 64.7% | 44.1% |
| Mean | 33.2% | 9.4% |
| Median | 28.2% | 9.0% |
| Interquartile 25% (IQ1) | 18.3% | 7.4% |
| Interquartile 75% (IQ3) | 46.7% | 10.7% |
| Interquartile Range (IQR) | 28.5% | 3.3% |
| Standard Deviation (Sample) | 18.8% | 5.5% |
| Standard Deviation (Population) | 18.5% | 5.5% |
Similar Demographics by Family Poverty
Demographics Similar to Tohono O'odham by Family Poverty
In terms of family poverty, the demographic groups most similar to Tohono O'odham are Puerto Rican (20.3%, a difference of 0.37%), Navajo (18.8%, a difference of 8.5%), Yup'ik (18.7%, a difference of 9.0%), Pima (18.4%, a difference of 11.1%), and Immigrants from Yemen (17.5%, a difference of 16.8%).
| Demographics | Rating | Rank | Family Poverty |
| Immigrants | Dominican Republic | 0.0 /100 | #333 | Tragic 14.4% |
| Houma | 0.0 /100 | #334 | Tragic 14.6% |
| Apache | 0.0 /100 | #335 | Tragic 14.7% |
| Sioux | 0.0 /100 | #336 | Tragic 15.9% |
| Hopi | 0.0 /100 | #337 | Tragic 15.9% |
| Crow | 0.0 /100 | #338 | Tragic 16.1% |
| Yuman | 0.0 /100 | #339 | Tragic 16.6% |
| Pueblo | 0.0 /100 | #340 | Tragic 17.0% |
| Lumbee | 0.0 /100 | #341 | Tragic 17.0% |
| Immigrants | Yemen | 0.0 /100 | #342 | Tragic 17.5% |
| Pima | 0.0 /100 | #343 | Tragic 18.4% |
| Yup'ik | 0.0 /100 | #344 | Tragic 18.7% |
| Navajo | 0.0 /100 | #345 | Tragic 18.8% |
| Puerto Ricans | 0.0 /100 | #346 | Tragic 20.3% |
| Tohono O'odham | 0.0 /100 | #347 | Tragic 20.4% |
Demographics Similar to Immigrants from Vietnam by Family Poverty
In terms of family poverty, the demographic groups most similar to Immigrants from Vietnam are Immigrants from Kuwait (8.7%, a difference of 0.33%), Immigrants from Spain (8.6%, a difference of 0.72%), Immigrants from Oceania (8.7%, a difference of 0.74%), Samoan (8.6%, a difference of 0.86%), and Brazilian (8.6%, a difference of 0.94%).
| Demographics | Rating | Rank | Family Poverty |
| Immigrants | Jordan | 83.0 /100 | #147 | Excellent 8.5% |
| Scotch-Irish | 82.2 /100 | #148 | Excellent 8.6% |
| Mongolians | 80.4 /100 | #149 | Excellent 8.6% |
| Syrians | 80.3 /100 | #150 | Excellent 8.6% |
| Brazilians | 80.1 /100 | #151 | Excellent 8.6% |
| Samoans | 79.8 /100 | #152 | Good 8.6% |
| Immigrants | Spain | 79.1 /100 | #153 | Good 8.6% |
| Immigrants | Vietnam | 75.4 /100 | #154 | Good 8.7% |
| Immigrants | Kuwait | 73.6 /100 | #155 | Good 8.7% |
| Immigrants | Oceania | 71.2 /100 | #156 | Good 8.7% |
| Tsimshian | 69.3 /100 | #157 | Good 8.8% |
| Whites/Caucasians | 69.1 /100 | #158 | Good 8.8% |
| Peruvians | 68.0 /100 | #159 | Good 8.8% |
| Hungarians | 67.2 /100 | #160 | Good 8.8% |
| Immigrants | Northern Africa | 66.9 /100 | #161 | Good 8.8% |