African vs Immigrants from Vietnam Family Poverty
COMPARE
African
Immigrants from Vietnam
Family Poverty
Family Poverty Comparison
Africans
Immigrants from Vietnam
11.8%
FAMILY POVERTY
0.0/ 100
METRIC RATING
303rd/ 347
METRIC RANK
8.7%
FAMILY POVERTY
75.4/ 100
METRIC RATING
154th/ 347
METRIC RANK
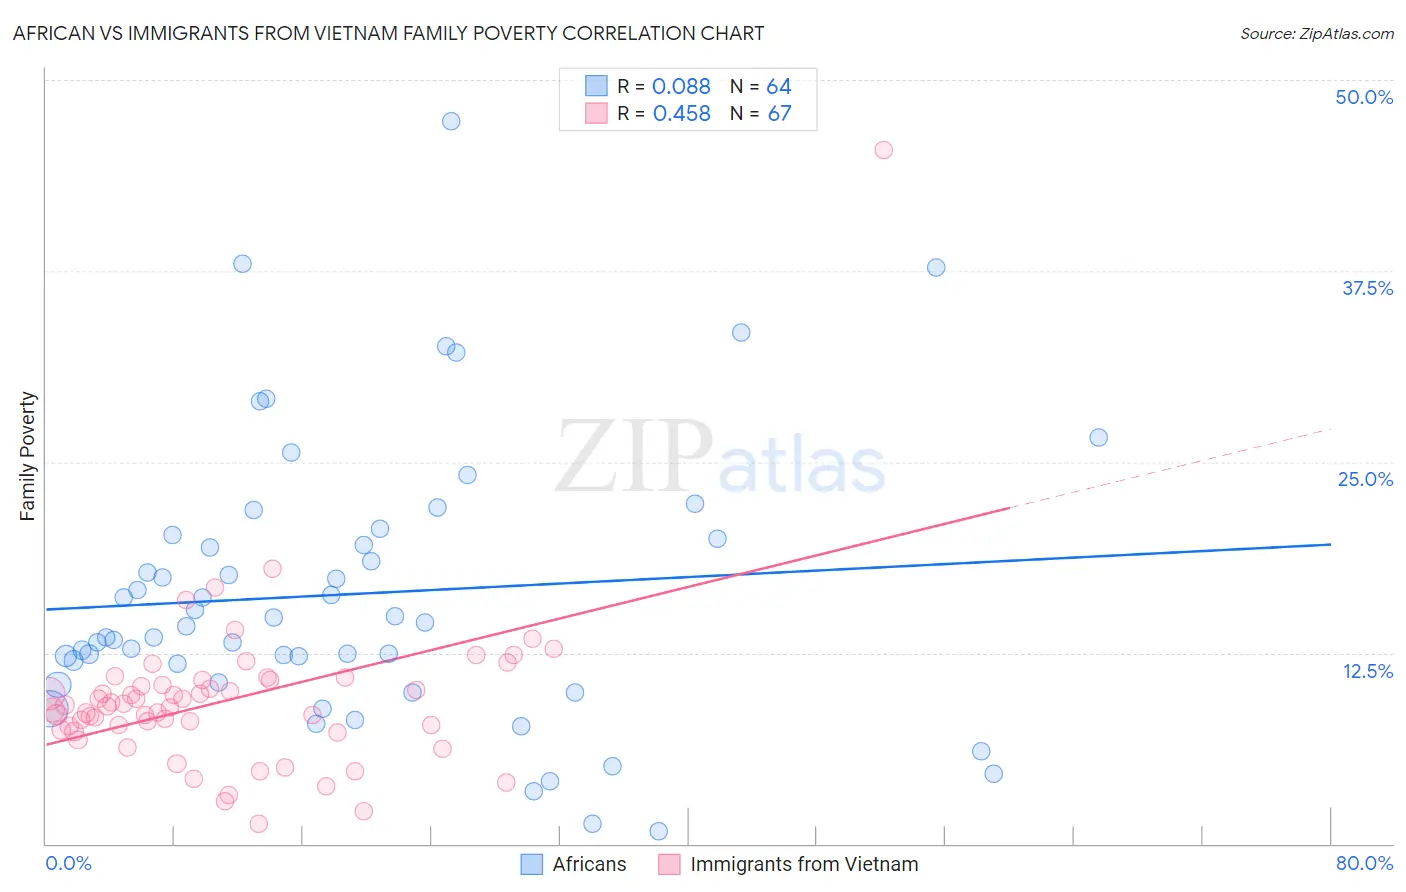
African vs Immigrants from Vietnam Family Poverty Correlation Chart
The statistical analysis conducted on geographies consisting of 468,652,941 people shows a slight positive correlation between the proportion of Africans and poverty level among families in the United States with a correlation coefficient (R) of 0.088 and weighted average of 11.8%. Similarly, the statistical analysis conducted on geographies consisting of 403,957,519 people shows a moderate positive correlation between the proportion of Immigrants from Vietnam and poverty level among families in the United States with a correlation coefficient (R) of 0.458 and weighted average of 8.7%, a difference of 35.7%.
Family Poverty Correlation Summary
| Measurement | African | Immigrants from Vietnam |
| Minimum | 0.78% | 1.3% |
| Maximum | 47.3% | 45.5% |
| Range | 46.5% | 44.1% |
| Mean | 16.4% | 9.4% |
| Median | 14.4% | 9.0% |
| Interquartile 25% (IQ1) | 11.2% | 7.4% |
| Interquartile 75% (IQ3) | 20.1% | 10.7% |
| Interquartile Range (IQR) | 9.0% | 3.3% |
| Standard Deviation (Sample) | 9.2% | 5.5% |
| Standard Deviation (Population) | 9.1% | 5.5% |
Similar Demographics by Family Poverty
Demographics Similar to Africans by Family Poverty
In terms of family poverty, the demographic groups most similar to Africans are Immigrants from Latin America (11.8%, a difference of 0.19%), Mexican (11.8%, a difference of 0.37%), Guatemalan (11.7%, a difference of 0.50%), Bahamian (11.7%, a difference of 0.54%), and Immigrants from Bangladesh (11.7%, a difference of 0.80%).
| Demographics | Rating | Rank | Family Poverty |
| Choctaw | 0.0 /100 | #296 | Tragic 11.6% |
| Creek | 0.0 /100 | #297 | Tragic 11.7% |
| Immigrants | Senegal | 0.0 /100 | #298 | Tragic 11.7% |
| Dutch West Indians | 0.0 /100 | #299 | Tragic 11.7% |
| Immigrants | Bangladesh | 0.0 /100 | #300 | Tragic 11.7% |
| Bahamians | 0.0 /100 | #301 | Tragic 11.7% |
| Guatemalans | 0.0 /100 | #302 | Tragic 11.7% |
| Africans | 0.0 /100 | #303 | Tragic 11.8% |
| Immigrants | Latin America | 0.0 /100 | #304 | Tragic 11.8% |
| Mexicans | 0.0 /100 | #305 | Tragic 11.8% |
| Cajuns | 0.0 /100 | #306 | Tragic 11.9% |
| Immigrants | Congo | 0.0 /100 | #307 | Tragic 11.9% |
| Seminole | 0.0 /100 | #308 | Tragic 11.9% |
| Hispanics or Latinos | 0.0 /100 | #309 | Tragic 12.0% |
| Immigrants | Guatemala | 0.0 /100 | #310 | Tragic 12.0% |
Demographics Similar to Immigrants from Vietnam by Family Poverty
In terms of family poverty, the demographic groups most similar to Immigrants from Vietnam are Immigrants from Kuwait (8.7%, a difference of 0.33%), Immigrants from Spain (8.6%, a difference of 0.72%), Immigrants from Oceania (8.7%, a difference of 0.74%), Samoan (8.6%, a difference of 0.86%), and Brazilian (8.6%, a difference of 0.94%).
| Demographics | Rating | Rank | Family Poverty |
| Immigrants | Jordan | 83.0 /100 | #147 | Excellent 8.5% |
| Scotch-Irish | 82.2 /100 | #148 | Excellent 8.6% |
| Mongolians | 80.4 /100 | #149 | Excellent 8.6% |
| Syrians | 80.3 /100 | #150 | Excellent 8.6% |
| Brazilians | 80.1 /100 | #151 | Excellent 8.6% |
| Samoans | 79.8 /100 | #152 | Good 8.6% |
| Immigrants | Spain | 79.1 /100 | #153 | Good 8.6% |
| Immigrants | Vietnam | 75.4 /100 | #154 | Good 8.7% |
| Immigrants | Kuwait | 73.6 /100 | #155 | Good 8.7% |
| Immigrants | Oceania | 71.2 /100 | #156 | Good 8.7% |
| Tsimshian | 69.3 /100 | #157 | Good 8.8% |
| Whites/Caucasians | 69.1 /100 | #158 | Good 8.8% |
| Peruvians | 68.0 /100 | #159 | Good 8.8% |
| Hungarians | 67.2 /100 | #160 | Good 8.8% |
| Immigrants | Northern Africa | 66.9 /100 | #161 | Good 8.8% |