Bangladeshi vs Immigrants from India Family Poverty

COMPARE

Bangladeshi
Race
Ancestry
AfghanAfricanAlaska NativeAlaskan AthabascanAlbanianAleutAlsatianAmericanApacheArabArapahoArgentineanArmenianAssyrian/Chaldean/SyriacAustralianAustrianBahamianBangladeshiBarbadianBasqueBelgianBelizeanBermudanBhutaneseBlackfeetBolivianBrazilianBritishBritish West IndianBulgarianBurmeseCajunCambodianCanadianCape VerdeanCarpatho RusynCelticCentral AmericanCentral American IndianCherokeeCheyenneChickasawChileanChineseChippewaChoctawColombianColvilleComancheCosta RicanCreeCreekCroatianCrowCubanCypriotCzechCzechoslovakianDanishDelawareDominicanDutchDutch West IndianEastern EuropeanEcuadorianEgyptianEnglishEstonianEthiopianEuropeanFijianFilipinoFinnishFrenchFrench American IndianFrench CanadianGermanGerman RussianGhanaianGreekGuamanian/ChamorroGuatemalanGuyaneseHaitianHmongHonduranHopiHoumaHungarianIcelanderIndian (Asian)IndonesianInupiatIranianIraqiIrishIroquoisIsraeliItalianJamaicanJapaneseJordanianKenyanKiowaKoreanLaotianLatvianLebaneseLiberianLithuanianLumbeeLuxembourgerMacedonianMalaysianMalteseMarshalleseMenomineeMexicanMexican American IndianMongolianMoroccanNative HawaiianNavajoNepaleseNew ZealanderNicaraguanNigerianNorthern EuropeanNorwegianOkinawanOsageOttawaPaiutePakistaniPalestinianPanamanianParaguayanPennsylvania GermanPeruvianPimaPolishPortuguesePotawatomiPuebloPuerto RicanPuget Sound SalishRomanianRussianSalvadoranSamoanScandinavianScotch-IrishScottishSeminoleSenegaleseSerbianShoshoneSierra LeoneanSiouxSlavicSlovakSloveneSomaliSouth AfricanSouth AmericanSouth American IndianSoviet UnionSpaniardSpanishSpanish AmericanSpanish American IndianSri LankanSubsaharan AfricanSudaneseSwedishSwissSyrianTaiwaneseThaiTlingit-HaidaTohono O'OdhamTonganTrinidadian and TobagonianTsimshianTurkishU.S. Virgin IslanderUgandanUkrainianUruguayanUteVenezuelanVietnameseWelshWest IndianYakamaYaquiYugoslavianYumanYup'ikZimbabwean
Immigration
NonimmigrantsImmigrantsAfghanistanAfricaAlbaniaArgentinaArmeniaAsiaAustraliaAustriaBahamasBangladeshBarbadosBelarusBelgiumBelizeBoliviaBosnia and HerzegovinaBrazilBulgariaBurma/MyanmarCabo VerdeCambodiaCameroonCanadaCaribbeanCentral AmericaChileChinaColombiaCongoCosta RicaCroatiaCubaCzechoslovakiaDenmarkDominicaDominican RepublicEastern AfricaEastern AsiaEastern EuropeEcuadorEgyptEl SalvadorEnglandEritreaEthiopiaEuropeFijiFranceGermanyGhanaGreeceGrenadaGuatemalaGuyanaHaitiHondurasHong KongHungaryIndonesiaIranIraqIrelandIsraelItalyJamaicaJapanJordanKazakhstanKenyaKoreaKuwaitLaosLatin AmericaLatviaLebanonLiberiaLithuaniaMalaysiaMexicoMicronesiaMiddle AfricaMoldovaMoroccoNepalNetherlandsNicaraguaNigeriaNorth AmericaNorth MacedoniaNorthern AfricaNorthern EuropeNorwayOceaniaPakistanPanamaPeruPhilippinesPolandPortugalRomaniaRussiaSaudi ArabiaScotlandSenegalSerbiaSierra LeoneSingaporeSomaliaSouth AfricaSouth AmericaSouth Central AsiaSouth Eastern AsiaSouthern EuropeSpainSri LankaSt. Vincent and the GrenadinesSudanSwedenSwitzerlandSyriaTaiwanThailandTrinidad and TobagoTurkeyUgandaUkraineUruguayUzbekistanVenezuelaVietnamWest IndiesWestern AfricaWestern AsiaWestern EuropeYemenZaireZimbabweAzores
Immigrants from India
Race
Ancestry
AfghanAfricanAlaska NativeAlaskan AthabascanAlbanianAleutAlsatianAmericanApacheArabArapahoArgentineanArmenianAssyrian/Chaldean/SyriacAustralianAustrianBahamianBarbadianBasqueBelgianBelizeanBermudanBhutaneseBlackfeetBolivianBrazilianBritishBritish West IndianBulgarianBurmeseCajunCambodianCanadianCape VerdeanCarpatho RusynCelticCentral AmericanCentral American IndianCherokeeCheyenneChickasawChileanChineseChippewaChoctawColombianColvilleComancheCosta RicanCreeCreekCroatianCrowCubanCypriotCzechCzechoslovakianDanishDelawareDominicanDutchDutch West IndianEastern EuropeanEcuadorianEgyptianEnglishEstonianEthiopianEuropeanFijianFilipinoFinnishFrenchFrench American IndianFrench CanadianGermanGerman RussianGhanaianGreekGuamanian/ChamorroGuatemalanGuyaneseHaitianHmongHonduranHopiHoumaHungarianIcelanderIndian (Asian)IndonesianInupiatIranianIraqiIrishIroquoisIsraeliItalianJamaicanJapaneseJordanianKenyanKiowaKoreanLaotianLatvianLebaneseLiberianLithuanianLumbeeLuxembourgerMacedonianMalaysianMalteseMarshalleseMenomineeMexicanMexican American IndianMongolianMoroccanNative HawaiianNavajoNepaleseNew ZealanderNicaraguanNigerianNorthern EuropeanNorwegianOkinawanOsageOttawaPaiutePakistaniPalestinianPanamanianParaguayanPennsylvania GermanPeruvianPimaPolishPortuguesePotawatomiPuebloPuerto RicanPuget Sound SalishRomanianRussianSalvadoranSamoanScandinavianScotch-IrishScottishSeminoleSenegaleseSerbianShoshoneSierra LeoneanSiouxSlavicSlovakSloveneSomaliSouth AfricanSouth AmericanSouth American IndianSoviet UnionSpaniardSpanishSpanish AmericanSpanish American IndianSri LankanSubsaharan AfricanSudaneseSwedishSwissSyrianTaiwaneseThaiTlingit-HaidaTohono O'OdhamTonganTrinidadian and TobagonianTsimshianTurkishU.S. Virgin IslanderUgandanUkrainianUruguayanUteVenezuelanVietnameseWelshWest IndianYakamaYaquiYugoslavianYumanYup'ikZimbabwean
Immigration
NonimmigrantsImmigrantsAfghanistanAfricaAlbaniaArgentinaArmeniaAsiaAustraliaAustriaBahamasBangladeshBarbadosBelarusBelgiumBelizeBoliviaBosnia and HerzegovinaBrazilBulgariaBurma/MyanmarCabo VerdeCambodiaCameroonCanadaCaribbeanCentral AmericaChileChinaColombiaCongoCosta RicaCroatiaCubaCzechoslovakiaDenmarkDominicaDominican RepublicEastern AfricaEastern AsiaEastern EuropeEcuadorEgyptEl SalvadorEnglandEritreaEthiopiaEuropeFijiFranceGermanyGhanaGreeceGrenadaGuatemalaGuyanaHaitiHondurasHong KongHungaryIndiaIndonesiaIranIraqIrelandIsraelItalyJamaicaJapanJordanKazakhstanKenyaKoreaKuwaitLaosLatin AmericaLatviaLebanonLiberiaLithuaniaMalaysiaMexicoMicronesiaMiddle AfricaMoldovaMoroccoNepalNetherlandsNicaraguaNigeriaNorth AmericaNorth MacedoniaNorthern AfricaNorthern EuropeNorwayOceaniaPakistanPanamaPeruPhilippinesPolandPortugalRomaniaRussiaSaudi ArabiaScotlandSenegalSerbiaSierra LeoneSingaporeSomaliaSouth AfricaSouth AmericaSouth Central AsiaSouth Eastern AsiaSouthern EuropeSpainSri LankaSt. Vincent and the GrenadinesSudanSwedenSwitzerlandSyriaTaiwanThailandTrinidad and TobagoTurkeyUgandaUkraineUruguayUzbekistanVenezuelaVietnamWest IndiesWestern AfricaWestern AsiaWestern EuropeYemenZaireZimbabweAzores
Family Poverty
Income
Poverty
Unemployment
Labor Participation
Family Structure
Vehicle Availability
Education Level
Disability

Family Poverty Comparison

Bangladeshis

Immigrants from India

Tragic
Exceptional
10.9%
FAMILY POVERTY
0.2/ 100
METRIC RATING
260th/ 347
METRIC RANK
6.2%
FAMILY POVERTY
100.0/ 100
METRIC RATING
1st/ 347
METRIC RANK

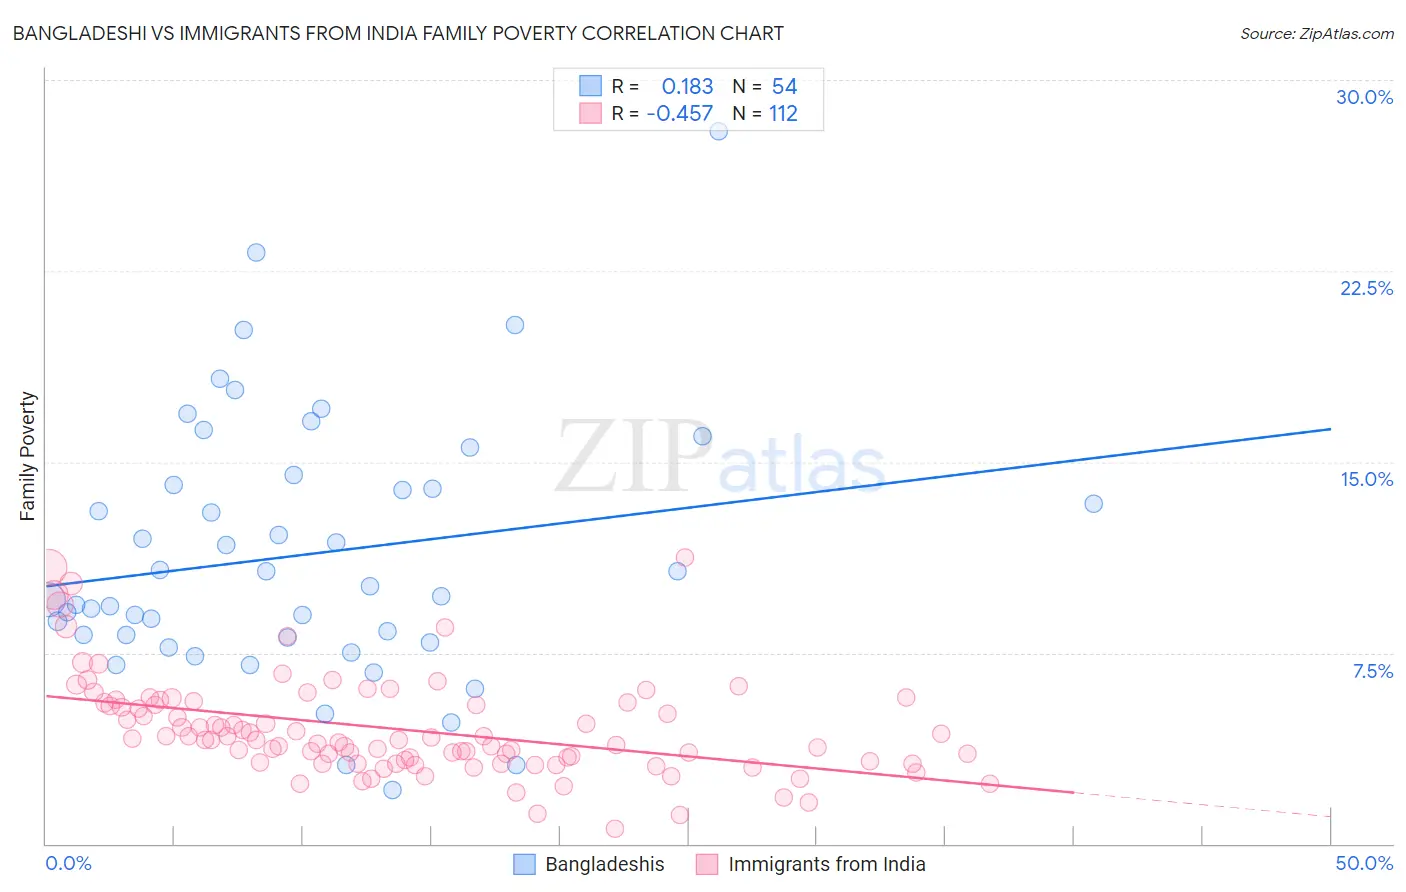
Bangladeshi vs Immigrants from India Family Poverty Correlation Chart

The statistical analysis conducted on geographies consisting of 141,248,982 people shows a poor positive correlation between the proportion of Bangladeshis and poverty level among families in the United States with a correlation coefficient (R) of 0.183 and weighted average of 10.9%. Similarly, the statistical analysis conducted on geographies consisting of 432,464,451 people shows a moderate negative correlation between the proportion of Immigrants from India and poverty level among families in the United States with a correlation coefficient (R) of -0.457 and weighted average of 6.2%, a difference of 74.7%.
Bangladeshi vs Immigrants from India Family Poverty

Family Poverty Correlation Summary

MeasurementBangladeshiImmigrants from India
Minimum2.1%0.60%
Maximum28.0%11.3%
Range25.9%10.7%
Mean11.3%4.5%
Median9.9%4.1%
Interquartile 25% (IQ1)8.1%3.2%
Interquartile 75% (IQ3)14.1%5.5%
Interquartile Range (IQR)6.0%2.3%
Standard Deviation (Sample)5.1%1.9%
Standard Deviation (Population)5.1%1.9%

Similar Demographics by Family Poverty

Demographics Similar to Bangladeshis by Family Poverty

In terms of family poverty, the demographic groups most similar to Bangladeshis are Shoshone (10.9%, a difference of 0.030%), Spanish American Indian (10.9%, a difference of 0.17%), Mexican American Indian (10.9%, a difference of 0.35%), Subsaharan African (10.9%, a difference of 0.39%), and Immigrants from Ghana (10.8%, a difference of 0.42%).
DemographicsRating | RankFamily Poverty
Immigrants | Western Africa
0.3
/100
|
#253
Tragic
10.7%
Ecuadorians
0.2
/100
|
#254
Tragic
10.8%
Immigrants | Liberia
0.2
/100
|
#255
Tragic
10.8%
Chickasaw
0.2
/100
|
#256
Tragic
10.8%
Immigrants | Ghana
0.2
/100
|
#257
Tragic
10.8%
Sub-Saharan Africans
0.2
/100
|
#258
Tragic
10.9%
Mexican American Indians
0.2
/100
|
#259
Tragic
10.9%
Bangladeshis
0.2
/100
|
#260
Tragic
10.9%
Shoshone
0.2
/100
|
#261
Tragic
10.9%
Spanish American Indians
0.2
/100
|
#262
Tragic
10.9%
Cape Verdeans
0.1
/100
|
#263
Tragic
10.9%
Trinidadians and Tobagonians
0.1
/100
|
#264
Tragic
10.9%
Immigrants | Trinidad and Tobago
0.1
/100
|
#265
Tragic
10.9%
Immigrants | El Salvador
0.1
/100
|
#266
Tragic
11.0%
Comanche
0.1
/100
|
#267
Tragic
11.0%

Demographics Similar to Immigrants from India by Family Poverty

In terms of family poverty, the demographic groups most similar to Immigrants from India are Chinese (6.5%, a difference of 4.3%), Immigrants from Taiwan (6.6%, a difference of 6.0%), Filipino (6.6%, a difference of 6.6%), Thai (6.7%, a difference of 7.2%), and Norwegian (6.9%, a difference of 10.5%).
DemographicsRating | RankFamily Poverty
Immigrants | India
100.0
/100
|
#1
Exceptional
6.2%
Chinese
100.0
/100
|
#2
Exceptional
6.5%
Immigrants | Taiwan
100.0
/100
|
#3
Exceptional
6.6%
Filipinos
100.0
/100
|
#4
Exceptional
6.6%
Thais
100.0
/100
|
#5
Exceptional
6.7%
Norwegians
99.9
/100
|
#6
Exceptional
6.9%
Immigrants | Ireland
99.9
/100
|
#7
Exceptional
7.0%
Bhutanese
99.9
/100
|
#8
Exceptional
7.0%
Latvians
99.9
/100
|
#9
Exceptional
7.1%
Bulgarians
99.8
/100
|
#10
Exceptional
7.1%
Immigrants | Singapore
99.8
/100
|
#11
Exceptional
7.1%
Maltese
99.8
/100
|
#12
Exceptional
7.1%
Swedes
99.8
/100
|
#13
Exceptional
7.1%
Iranians
99.8
/100
|
#14
Exceptional
7.1%
Lithuanians
99.8
/100
|
#15
Exceptional
7.2%