Arapaho vs Immigrants from Vietnam Family Poverty
COMPARE
Arapaho
Immigrants from Vietnam
Family Poverty
Family Poverty Comparison
Arapaho
Immigrants from Vietnam
12.7%
FAMILY POVERTY
0.0/ 100
METRIC RATING
321st/ 347
METRIC RANK
8.7%
FAMILY POVERTY
75.4/ 100
METRIC RATING
154th/ 347
METRIC RANK
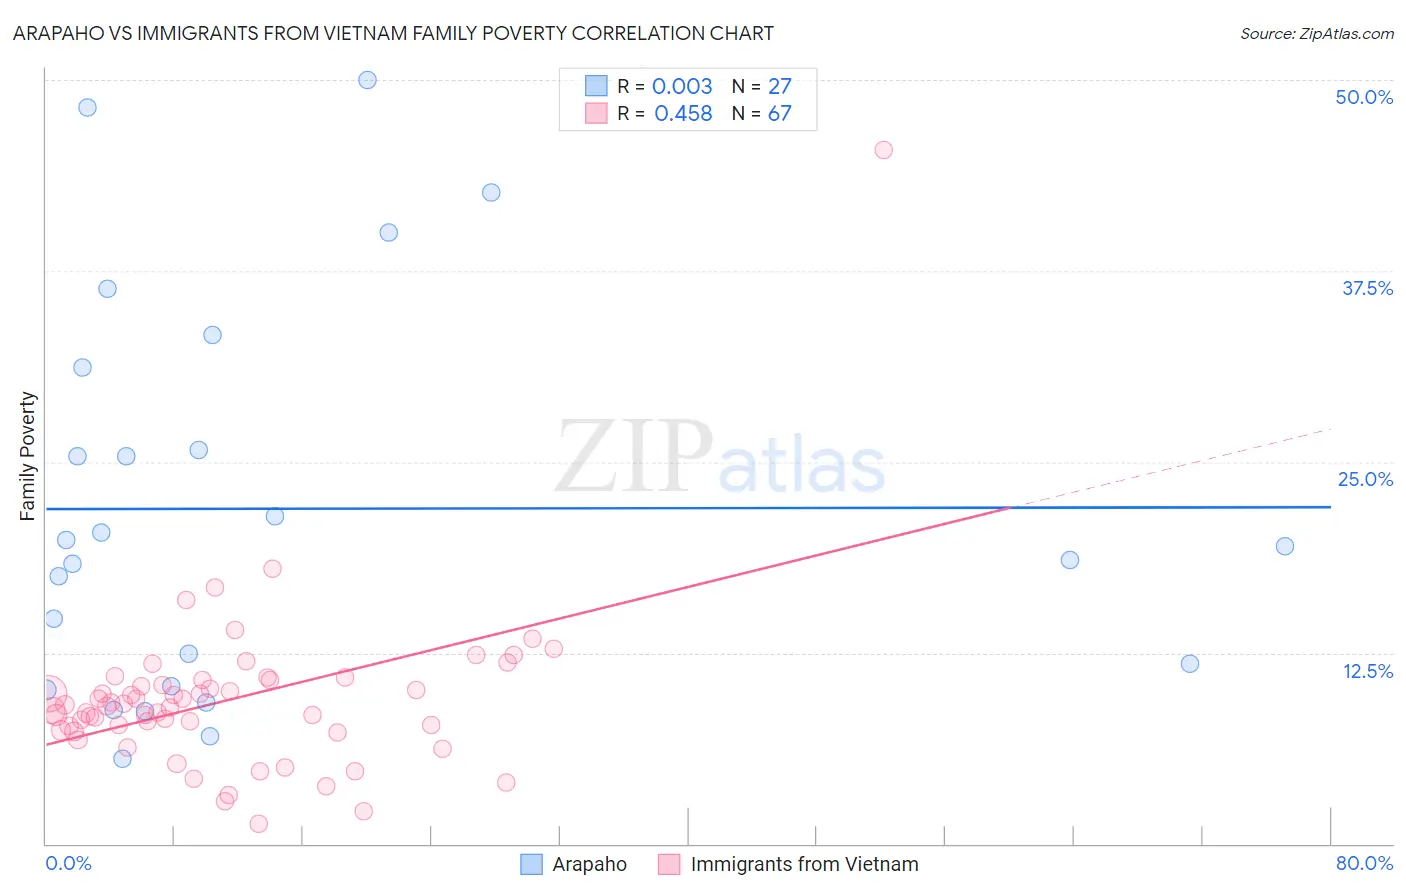
Arapaho vs Immigrants from Vietnam Family Poverty Correlation Chart
The statistical analysis conducted on geographies consisting of 29,764,504 people shows no correlation between the proportion of Arapaho and poverty level among families in the United States with a correlation coefficient (R) of 0.003 and weighted average of 12.7%. Similarly, the statistical analysis conducted on geographies consisting of 403,957,519 people shows a moderate positive correlation between the proportion of Immigrants from Vietnam and poverty level among families in the United States with a correlation coefficient (R) of 0.458 and weighted average of 8.7%, a difference of 45.8%.
Family Poverty Correlation Summary
| Measurement | Arapaho | Immigrants from Vietnam |
| Minimum | 5.6% | 1.3% |
| Maximum | 50.0% | 45.5% |
| Range | 44.4% | 44.1% |
| Mean | 21.9% | 9.4% |
| Median | 19.5% | 9.0% |
| Interquartile 25% (IQ1) | 10.3% | 7.4% |
| Interquartile 75% (IQ3) | 31.2% | 10.7% |
| Interquartile Range (IQR) | 20.8% | 3.3% |
| Standard Deviation (Sample) | 12.8% | 5.5% |
| Standard Deviation (Population) | 12.6% | 5.5% |
Similar Demographics by Family Poverty
Demographics Similar to Arapaho by Family Poverty
In terms of family poverty, the demographic groups most similar to Arapaho are Immigrants from Honduras (12.7%, a difference of 0.10%), Menominee (12.7%, a difference of 0.65%), Immigrants from Dominica (12.7%, a difference of 0.72%), Inupiat (12.5%, a difference of 1.5%), and British West Indian (12.4%, a difference of 2.0%).
| Demographics | Rating | Rank | Family Poverty |
| Kiowa | 0.0 /100 | #314 | Tragic 12.2% |
| Immigrants | Mexico | 0.0 /100 | #315 | Tragic 12.3% |
| Hondurans | 0.0 /100 | #316 | Tragic 12.4% |
| Immigrants | Grenada | 0.0 /100 | #317 | Tragic 12.4% |
| U.S. Virgin Islanders | 0.0 /100 | #318 | Tragic 12.4% |
| British West Indians | 0.0 /100 | #319 | Tragic 12.4% |
| Inupiat | 0.0 /100 | #320 | Tragic 12.5% |
| Arapaho | 0.0 /100 | #321 | Tragic 12.7% |
| Immigrants | Honduras | 0.0 /100 | #322 | Tragic 12.7% |
| Menominee | 0.0 /100 | #323 | Tragic 12.7% |
| Immigrants | Dominica | 0.0 /100 | #324 | Tragic 12.7% |
| Paiute | 0.0 /100 | #325 | Tragic 13.0% |
| Colville | 0.0 /100 | #326 | Tragic 13.0% |
| Yakama | 0.0 /100 | #327 | Tragic 13.1% |
| Central American Indians | 0.0 /100 | #328 | Tragic 13.3% |
Demographics Similar to Immigrants from Vietnam by Family Poverty
In terms of family poverty, the demographic groups most similar to Immigrants from Vietnam are Immigrants from Kuwait (8.7%, a difference of 0.33%), Immigrants from Spain (8.6%, a difference of 0.72%), Immigrants from Oceania (8.7%, a difference of 0.74%), Samoan (8.6%, a difference of 0.86%), and Brazilian (8.6%, a difference of 0.94%).
| Demographics | Rating | Rank | Family Poverty |
| Immigrants | Jordan | 83.0 /100 | #147 | Excellent 8.5% |
| Scotch-Irish | 82.2 /100 | #148 | Excellent 8.6% |
| Mongolians | 80.4 /100 | #149 | Excellent 8.6% |
| Syrians | 80.3 /100 | #150 | Excellent 8.6% |
| Brazilians | 80.1 /100 | #151 | Excellent 8.6% |
| Samoans | 79.8 /100 | #152 | Good 8.6% |
| Immigrants | Spain | 79.1 /100 | #153 | Good 8.6% |
| Immigrants | Vietnam | 75.4 /100 | #154 | Good 8.7% |
| Immigrants | Kuwait | 73.6 /100 | #155 | Good 8.7% |
| Immigrants | Oceania | 71.2 /100 | #156 | Good 8.7% |
| Tsimshian | 69.3 /100 | #157 | Good 8.8% |
| Whites/Caucasians | 69.1 /100 | #158 | Good 8.8% |
| Peruvians | 68.0 /100 | #159 | Good 8.8% |
| Hungarians | 67.2 /100 | #160 | Good 8.8% |
| Immigrants | Northern Africa | 66.9 /100 | #161 | Good 8.8% |