Bangladeshi vs Immigrants from Dominica Family Poverty
COMPARE
Bangladeshi
Immigrants from Dominica
Family Poverty
Family Poverty Comparison
Bangladeshis
Immigrants from Dominica
10.9%
FAMILY POVERTY
0.2/ 100
METRIC RATING
260th/ 347
METRIC RANK
12.7%
FAMILY POVERTY
0.0/ 100
METRIC RATING
324th/ 347
METRIC RANK
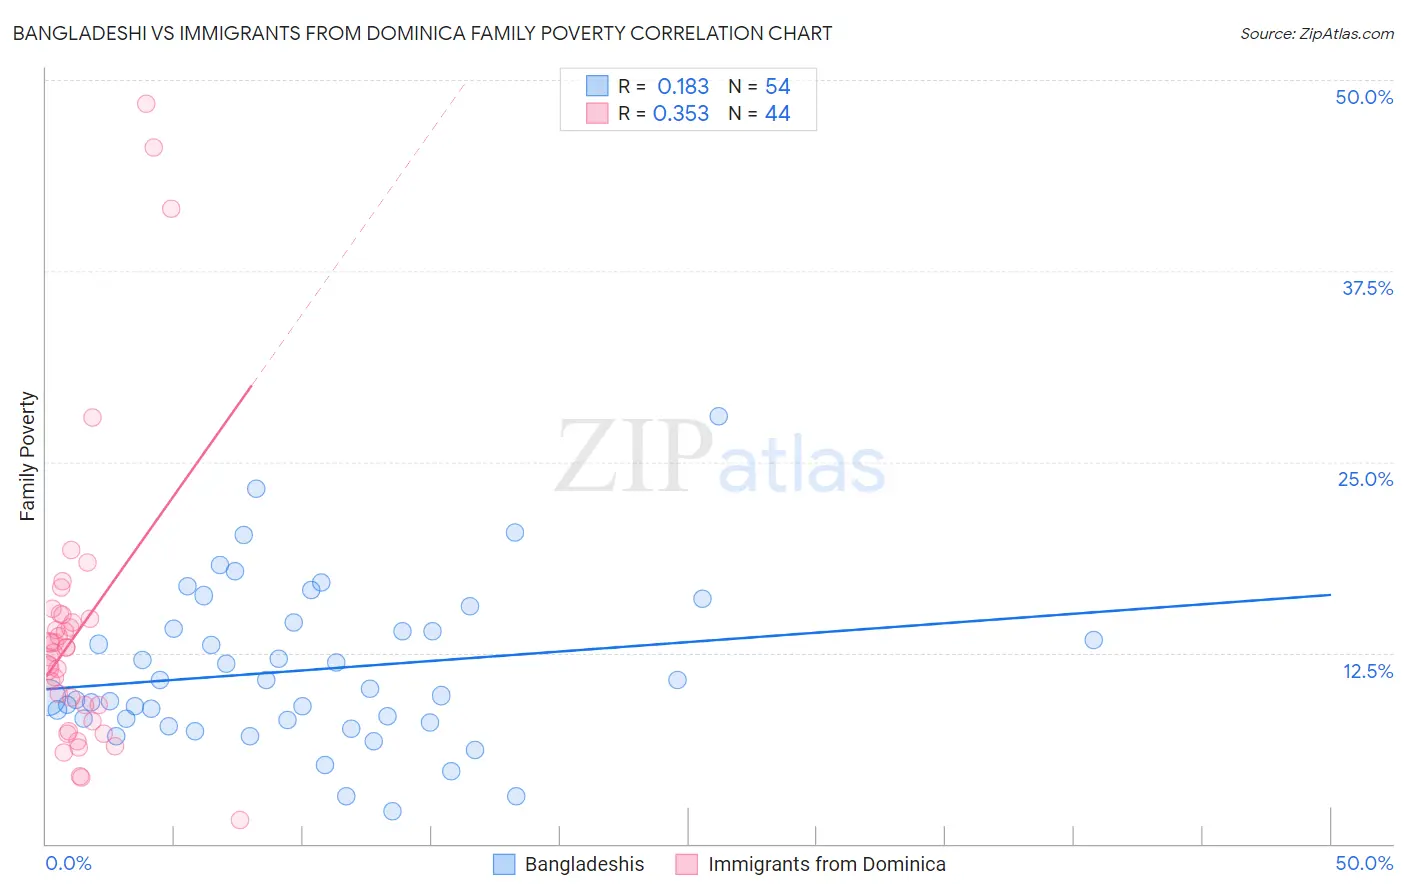
Bangladeshi vs Immigrants from Dominica Family Poverty Correlation Chart
The statistical analysis conducted on geographies consisting of 141,248,982 people shows a poor positive correlation between the proportion of Bangladeshis and poverty level among families in the United States with a correlation coefficient (R) of 0.183 and weighted average of 10.9%. Similarly, the statistical analysis conducted on geographies consisting of 83,762,031 people shows a mild positive correlation between the proportion of Immigrants from Dominica and poverty level among families in the United States with a correlation coefficient (R) of 0.353 and weighted average of 12.7%, a difference of 17.0%.
Family Poverty Correlation Summary
| Measurement | Bangladeshi | Immigrants from Dominica |
| Minimum | 2.1% | 1.5% |
| Maximum | 28.0% | 48.5% |
| Range | 25.9% | 47.0% |
| Mean | 11.3% | 14.0% |
| Median | 9.9% | 12.7% |
| Interquartile 25% (IQ1) | 8.1% | 8.5% |
| Interquartile 75% (IQ3) | 14.1% | 14.9% |
| Interquartile Range (IQR) | 6.0% | 6.3% |
| Standard Deviation (Sample) | 5.1% | 9.8% |
| Standard Deviation (Population) | 5.1% | 9.6% |
Similar Demographics by Family Poverty
Demographics Similar to Bangladeshis by Family Poverty
In terms of family poverty, the demographic groups most similar to Bangladeshis are Shoshone (10.9%, a difference of 0.030%), Spanish American Indian (10.9%, a difference of 0.17%), Mexican American Indian (10.9%, a difference of 0.35%), Subsaharan African (10.9%, a difference of 0.39%), and Immigrants from Ghana (10.8%, a difference of 0.42%).
| Demographics | Rating | Rank | Family Poverty |
| Immigrants | Western Africa | 0.3 /100 | #253 | Tragic 10.7% |
| Ecuadorians | 0.2 /100 | #254 | Tragic 10.8% |
| Immigrants | Liberia | 0.2 /100 | #255 | Tragic 10.8% |
| Chickasaw | 0.2 /100 | #256 | Tragic 10.8% |
| Immigrants | Ghana | 0.2 /100 | #257 | Tragic 10.8% |
| Sub-Saharan Africans | 0.2 /100 | #258 | Tragic 10.9% |
| Mexican American Indians | 0.2 /100 | #259 | Tragic 10.9% |
| Bangladeshis | 0.2 /100 | #260 | Tragic 10.9% |
| Shoshone | 0.2 /100 | #261 | Tragic 10.9% |
| Spanish American Indians | 0.2 /100 | #262 | Tragic 10.9% |
| Cape Verdeans | 0.1 /100 | #263 | Tragic 10.9% |
| Trinidadians and Tobagonians | 0.1 /100 | #264 | Tragic 10.9% |
| Immigrants | Trinidad and Tobago | 0.1 /100 | #265 | Tragic 10.9% |
| Immigrants | El Salvador | 0.1 /100 | #266 | Tragic 11.0% |
| Comanche | 0.1 /100 | #267 | Tragic 11.0% |
Demographics Similar to Immigrants from Dominica by Family Poverty
In terms of family poverty, the demographic groups most similar to Immigrants from Dominica are Menominee (12.7%, a difference of 0.080%), Immigrants from Honduras (12.7%, a difference of 0.62%), Arapaho (12.7%, a difference of 0.72%), Paiute (13.0%, a difference of 2.0%), and Colville (13.0%, a difference of 2.0%).
| Demographics | Rating | Rank | Family Poverty |
| Immigrants | Grenada | 0.0 /100 | #317 | Tragic 12.4% |
| U.S. Virgin Islanders | 0.0 /100 | #318 | Tragic 12.4% |
| British West Indians | 0.0 /100 | #319 | Tragic 12.4% |
| Inupiat | 0.0 /100 | #320 | Tragic 12.5% |
| Arapaho | 0.0 /100 | #321 | Tragic 12.7% |
| Immigrants | Honduras | 0.0 /100 | #322 | Tragic 12.7% |
| Menominee | 0.0 /100 | #323 | Tragic 12.7% |
| Immigrants | Dominica | 0.0 /100 | #324 | Tragic 12.7% |
| Paiute | 0.0 /100 | #325 | Tragic 13.0% |
| Colville | 0.0 /100 | #326 | Tragic 13.0% |
| Yakama | 0.0 /100 | #327 | Tragic 13.1% |
| Central American Indians | 0.0 /100 | #328 | Tragic 13.3% |
| Blacks/African Americans | 0.0 /100 | #329 | Tragic 13.3% |
| Natives/Alaskans | 0.0 /100 | #330 | Tragic 14.3% |
| Cheyenne | 0.0 /100 | #331 | Tragic 14.3% |