Apache vs Soviet Union Receiving Food Stamps
COMPARE
Apache
Soviet Union
Receiving Food Stamps
Receiving Food Stamps Comparison
Apache
Soviet Union
18.3%
RECEIVING FOOD STAMPS
0.0/ 100
METRIC RATING
327th/ 347
METRIC RANK
11.1%
RECEIVING FOOD STAMPS
83.1/ 100
METRIC RATING
150th/ 347
METRIC RANK
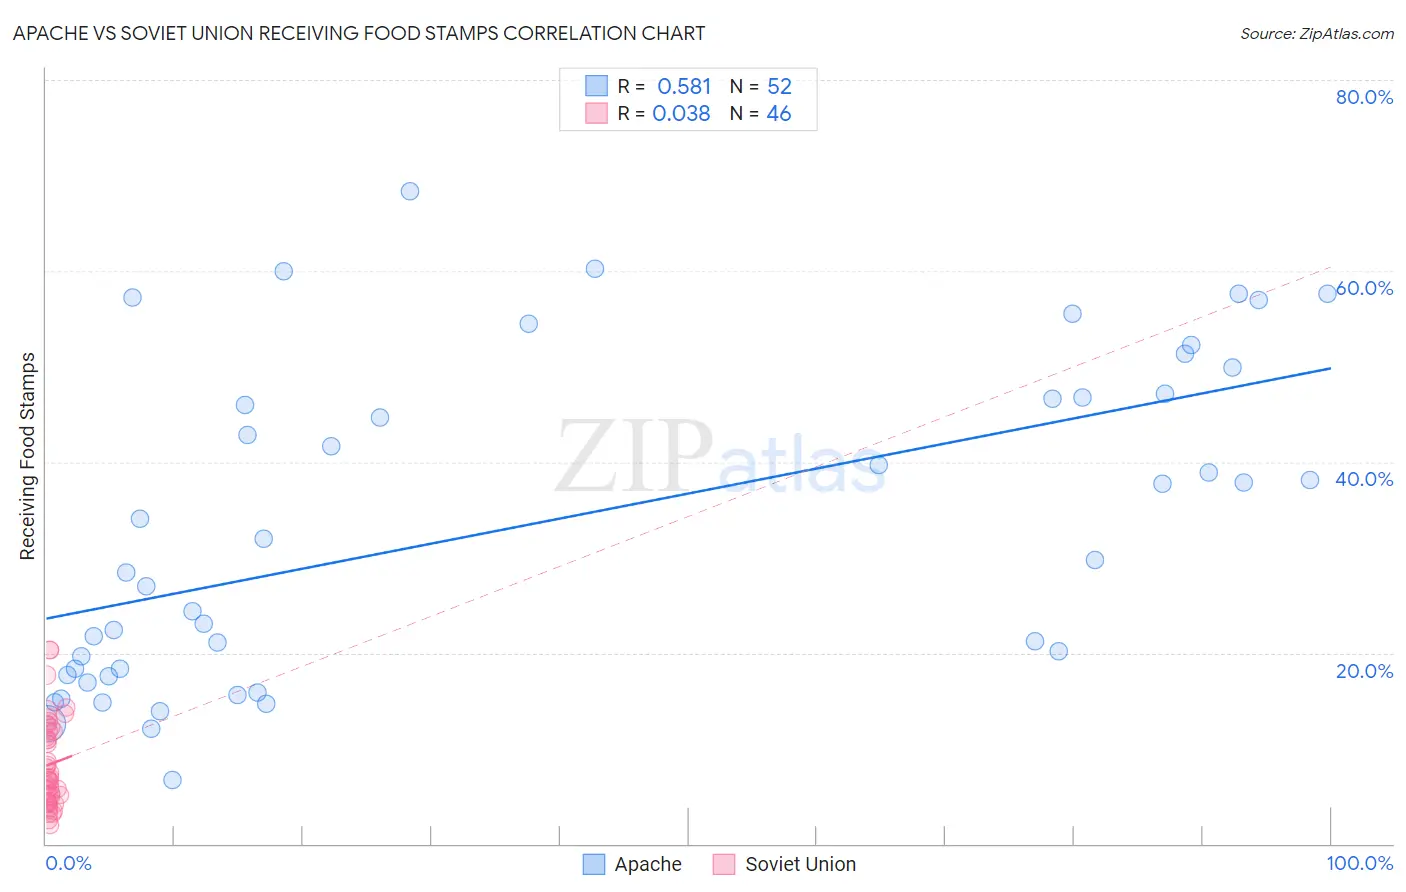
Apache vs Soviet Union Receiving Food Stamps Correlation Chart
The statistical analysis conducted on geographies consisting of 230,963,565 people shows a substantial positive correlation between the proportion of Apache and percentage of population receiving government assistance and/or food stamps in the United States with a correlation coefficient (R) of 0.581 and weighted average of 18.3%. Similarly, the statistical analysis conducted on geographies consisting of 43,471,584 people shows no correlation between the proportion of Soviet Union and percentage of population receiving government assistance and/or food stamps in the United States with a correlation coefficient (R) of 0.038 and weighted average of 11.1%, a difference of 65.0%.
Receiving Food Stamps Correlation Summary
| Measurement | Apache | Soviet Union |
| Minimum | 6.6% | 1.9% |
| Maximum | 68.4% | 20.3% |
| Range | 61.8% | 18.4% |
| Mean | 33.4% | 8.3% |
| Median | 30.8% | 6.8% |
| Interquartile 25% (IQ1) | 18.0% | 4.4% |
| Interquartile 75% (IQ3) | 47.0% | 11.8% |
| Interquartile Range (IQR) | 29.0% | 7.4% |
| Standard Deviation (Sample) | 16.8% | 4.6% |
| Standard Deviation (Population) | 16.6% | 4.6% |
Similar Demographics by Receiving Food Stamps
Demographics Similar to Apache by Receiving Food Stamps
In terms of receiving food stamps, the demographic groups most similar to Apache are Colville (18.3%, a difference of 0.21%), Cuban (18.2%, a difference of 0.31%), Immigrants from Haiti (18.2%, a difference of 0.42%), Immigrants from Dominica (18.4%, a difference of 0.67%), and British West Indian (17.9%, a difference of 2.2%).
| Demographics | Rating | Rank | Receiving Food Stamps |
| Immigrants | Nicaragua | 0.0 /100 | #320 | Tragic 17.2% |
| Natives/Alaskans | 0.0 /100 | #321 | Tragic 17.3% |
| Immigrants | Grenada | 0.0 /100 | #322 | Tragic 17.8% |
| Haitians | 0.0 /100 | #323 | Tragic 17.8% |
| British West Indians | 0.0 /100 | #324 | Tragic 17.9% |
| Immigrants | Haiti | 0.0 /100 | #325 | Tragic 18.2% |
| Cubans | 0.0 /100 | #326 | Tragic 18.2% |
| Apache | 0.0 /100 | #327 | Tragic 18.3% |
| Colville | 0.0 /100 | #328 | Tragic 18.3% |
| Immigrants | Dominica | 0.0 /100 | #329 | Tragic 18.4% |
| Pima | 0.0 /100 | #330 | Tragic 19.0% |
| Immigrants | Caribbean | 0.0 /100 | #331 | Tragic 19.6% |
| Pueblo | 0.0 /100 | #332 | Tragic 19.9% |
| Inupiat | 0.0 /100 | #333 | Tragic 20.1% |
| Yuman | 0.0 /100 | #334 | Tragic 20.2% |
Demographics Similar to Soviet Union by Receiving Food Stamps
In terms of receiving food stamps, the demographic groups most similar to Soviet Union are Brazilian (11.1%, a difference of 0.020%), Immigrants from South Eastern Asia (11.1%, a difference of 0.040%), White/Caucasian (11.1%, a difference of 0.21%), Taiwanese (11.0%, a difference of 0.30%), and Immigrants from Spain (11.1%, a difference of 0.36%).
| Demographics | Rating | Rank | Receiving Food Stamps |
| Immigrants | Northern Africa | 86.0 /100 | #143 | Excellent 11.0% |
| Syrians | 85.5 /100 | #144 | Excellent 11.0% |
| Hungarians | 85.1 /100 | #145 | Excellent 11.0% |
| Taiwanese | 84.2 /100 | #146 | Excellent 11.0% |
| Whites/Caucasians | 83.9 /100 | #147 | Excellent 11.1% |
| Immigrants | South Eastern Asia | 83.3 /100 | #148 | Excellent 11.1% |
| Brazilians | 83.2 /100 | #149 | Excellent 11.1% |
| Soviet Union | 83.1 /100 | #150 | Excellent 11.1% |
| Immigrants | Spain | 81.7 /100 | #151 | Excellent 11.1% |
| Immigrants | Kazakhstan | 81.7 /100 | #152 | Excellent 11.1% |
| Lebanese | 81.6 /100 | #153 | Excellent 11.1% |
| Armenians | 81.4 /100 | #154 | Excellent 11.1% |
| Immigrants | Argentina | 80.4 /100 | #155 | Excellent 11.2% |
| Immigrants | Afghanistan | 75.6 /100 | #156 | Good 11.3% |
| Immigrants | Lebanon | 75.2 /100 | #157 | Good 11.3% |