Apache vs Immigrants from Kenya Receiving Food Stamps
COMPARE
Apache
Immigrants from Kenya
Receiving Food Stamps
Receiving Food Stamps Comparison
Apache
Immigrants from Kenya
18.3%
RECEIVING FOOD STAMPS
0.0/ 100
METRIC RATING
327th/ 347
METRIC RANK
11.8%
RECEIVING FOOD STAMPS
46.4/ 100
METRIC RATING
179th/ 347
METRIC RANK
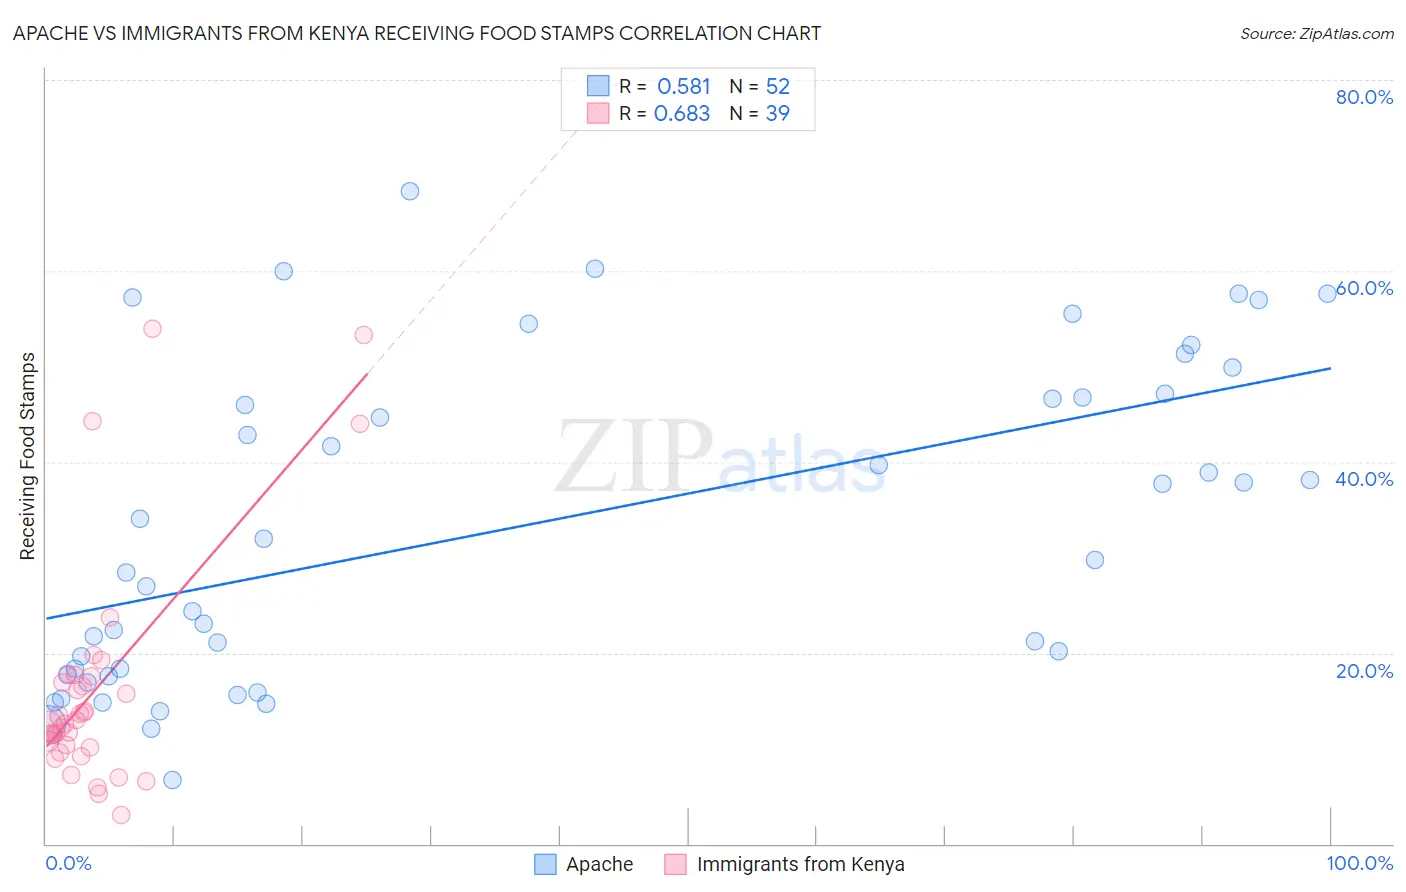
Apache vs Immigrants from Kenya Receiving Food Stamps Correlation Chart
The statistical analysis conducted on geographies consisting of 230,963,565 people shows a substantial positive correlation between the proportion of Apache and percentage of population receiving government assistance and/or food stamps in the United States with a correlation coefficient (R) of 0.581 and weighted average of 18.3%. Similarly, the statistical analysis conducted on geographies consisting of 217,816,837 people shows a significant positive correlation between the proportion of Immigrants from Kenya and percentage of population receiving government assistance and/or food stamps in the United States with a correlation coefficient (R) of 0.683 and weighted average of 11.8%, a difference of 55.0%.
Receiving Food Stamps Correlation Summary
| Measurement | Apache | Immigrants from Kenya |
| Minimum | 6.6% | 3.0% |
| Maximum | 68.4% | 54.0% |
| Range | 61.8% | 51.0% |
| Mean | 33.4% | 16.2% |
| Median | 30.8% | 12.6% |
| Interquartile 25% (IQ1) | 18.0% | 10.1% |
| Interquartile 75% (IQ3) | 47.0% | 17.5% |
| Interquartile Range (IQR) | 29.0% | 7.4% |
| Standard Deviation (Sample) | 16.8% | 12.1% |
| Standard Deviation (Population) | 16.6% | 11.9% |
Similar Demographics by Receiving Food Stamps
Demographics Similar to Apache by Receiving Food Stamps
In terms of receiving food stamps, the demographic groups most similar to Apache are Colville (18.3%, a difference of 0.21%), Cuban (18.2%, a difference of 0.31%), Immigrants from Haiti (18.2%, a difference of 0.42%), Immigrants from Dominica (18.4%, a difference of 0.67%), and British West Indian (17.9%, a difference of 2.2%).
| Demographics | Rating | Rank | Receiving Food Stamps |
| Immigrants | Nicaragua | 0.0 /100 | #320 | Tragic 17.2% |
| Natives/Alaskans | 0.0 /100 | #321 | Tragic 17.3% |
| Immigrants | Grenada | 0.0 /100 | #322 | Tragic 17.8% |
| Haitians | 0.0 /100 | #323 | Tragic 17.8% |
| British West Indians | 0.0 /100 | #324 | Tragic 17.9% |
| Immigrants | Haiti | 0.0 /100 | #325 | Tragic 18.2% |
| Cubans | 0.0 /100 | #326 | Tragic 18.2% |
| Apache | 0.0 /100 | #327 | Tragic 18.3% |
| Colville | 0.0 /100 | #328 | Tragic 18.3% |
| Immigrants | Dominica | 0.0 /100 | #329 | Tragic 18.4% |
| Pima | 0.0 /100 | #330 | Tragic 19.0% |
| Immigrants | Caribbean | 0.0 /100 | #331 | Tragic 19.6% |
| Pueblo | 0.0 /100 | #332 | Tragic 19.9% |
| Inupiat | 0.0 /100 | #333 | Tragic 20.1% |
| Yuman | 0.0 /100 | #334 | Tragic 20.2% |
Demographics Similar to Immigrants from Kenya by Receiving Food Stamps
In terms of receiving food stamps, the demographic groups most similar to Immigrants from Kenya are Uruguayan (11.8%, a difference of 0.22%), German Russian (11.8%, a difference of 0.24%), Immigrants from Ukraine (11.8%, a difference of 0.28%), Peruvian (11.7%, a difference of 0.41%), and Osage (11.7%, a difference of 0.48%).
| Demographics | Rating | Rank | Receiving Food Stamps |
| Guamanians/Chamorros | 54.2 /100 | #172 | Average 11.7% |
| Immigrants | Syria | 53.4 /100 | #173 | Average 11.7% |
| Immigrants | Eritrea | 50.0 /100 | #174 | Average 11.7% |
| Osage | 49.8 /100 | #175 | Average 11.7% |
| Peruvians | 49.3 /100 | #176 | Average 11.7% |
| Immigrants | Ukraine | 48.4 /100 | #177 | Average 11.8% |
| German Russians | 48.1 /100 | #178 | Average 11.8% |
| Immigrants | Kenya | 46.4 /100 | #179 | Average 11.8% |
| Uruguayans | 44.8 /100 | #180 | Average 11.8% |
| South American Indians | 41.7 /100 | #181 | Average 11.9% |
| Immigrants | Morocco | 40.7 /100 | #182 | Average 11.9% |
| Immigrants | Uganda | 40.3 /100 | #183 | Average 11.9% |
| Spaniards | 39.8 /100 | #184 | Fair 11.9% |
| Immigrants | Iraq | 37.1 /100 | #185 | Fair 12.0% |
| Spanish | 36.9 /100 | #186 | Fair 12.0% |