Apache vs Moroccan Receiving Food Stamps
COMPARE
Apache
Moroccan
Receiving Food Stamps
Receiving Food Stamps Comparison
Apache
Moroccans
18.3%
RECEIVING FOOD STAMPS
0.0/ 100
METRIC RATING
327th/ 347
METRIC RANK
12.8%
RECEIVING FOOD STAMPS
7.6/ 100
METRIC RATING
213th/ 347
METRIC RANK
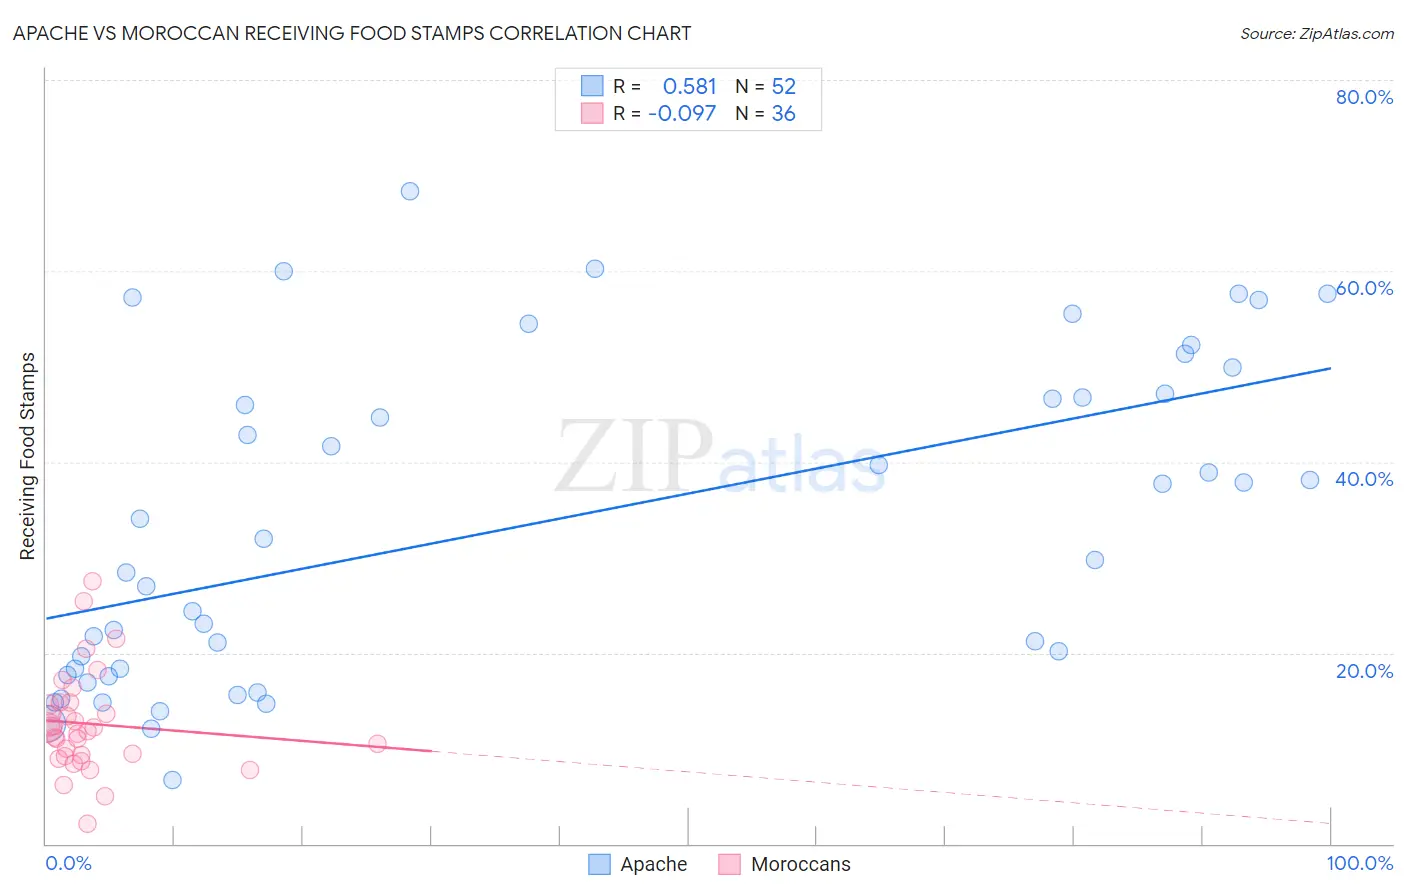
Apache vs Moroccan Receiving Food Stamps Correlation Chart
The statistical analysis conducted on geographies consisting of 230,963,565 people shows a substantial positive correlation between the proportion of Apache and percentage of population receiving government assistance and/or food stamps in the United States with a correlation coefficient (R) of 0.581 and weighted average of 18.3%. Similarly, the statistical analysis conducted on geographies consisting of 201,594,940 people shows a slight negative correlation between the proportion of Moroccans and percentage of population receiving government assistance and/or food stamps in the United States with a correlation coefficient (R) of -0.097 and weighted average of 12.8%, a difference of 43.2%.
Receiving Food Stamps Correlation Summary
| Measurement | Apache | Moroccan |
| Minimum | 6.6% | 2.1% |
| Maximum | 68.4% | 27.5% |
| Range | 61.8% | 25.4% |
| Mean | 33.4% | 12.6% |
| Median | 30.8% | 12.0% |
| Interquartile 25% (IQ1) | 18.0% | 9.2% |
| Interquartile 75% (IQ3) | 47.0% | 14.6% |
| Interquartile Range (IQR) | 29.0% | 5.4% |
| Standard Deviation (Sample) | 16.8% | 5.3% |
| Standard Deviation (Population) | 16.6% | 5.2% |
Similar Demographics by Receiving Food Stamps
Demographics Similar to Apache by Receiving Food Stamps
In terms of receiving food stamps, the demographic groups most similar to Apache are Colville (18.3%, a difference of 0.21%), Cuban (18.2%, a difference of 0.31%), Immigrants from Haiti (18.2%, a difference of 0.42%), Immigrants from Dominica (18.4%, a difference of 0.67%), and British West Indian (17.9%, a difference of 2.2%).
| Demographics | Rating | Rank | Receiving Food Stamps |
| Immigrants | Nicaragua | 0.0 /100 | #320 | Tragic 17.2% |
| Natives/Alaskans | 0.0 /100 | #321 | Tragic 17.3% |
| Immigrants | Grenada | 0.0 /100 | #322 | Tragic 17.8% |
| Haitians | 0.0 /100 | #323 | Tragic 17.8% |
| British West Indians | 0.0 /100 | #324 | Tragic 17.9% |
| Immigrants | Haiti | 0.0 /100 | #325 | Tragic 18.2% |
| Cubans | 0.0 /100 | #326 | Tragic 18.2% |
| Apache | 0.0 /100 | #327 | Tragic 18.3% |
| Colville | 0.0 /100 | #328 | Tragic 18.3% |
| Immigrants | Dominica | 0.0 /100 | #329 | Tragic 18.4% |
| Pima | 0.0 /100 | #330 | Tragic 19.0% |
| Immigrants | Caribbean | 0.0 /100 | #331 | Tragic 19.6% |
| Pueblo | 0.0 /100 | #332 | Tragic 19.9% |
| Inupiat | 0.0 /100 | #333 | Tragic 20.1% |
| Yuman | 0.0 /100 | #334 | Tragic 20.2% |
Demographics Similar to Moroccans by Receiving Food Stamps
In terms of receiving food stamps, the demographic groups most similar to Moroccans are Immigrants from Africa (12.8%, a difference of 0.030%), Malaysian (12.7%, a difference of 0.40%), Native Hawaiian (12.8%, a difference of 0.47%), Immigrants from South America (12.8%, a difference of 0.58%), and Immigrants from Burma/Myanmar (12.9%, a difference of 0.84%).
| Demographics | Rating | Rank | Receiving Food Stamps |
| Immigrants | Thailand | 17.0 /100 | #206 | Poor 12.4% |
| South Americans | 16.0 /100 | #207 | Poor 12.4% |
| Potawatomi | 14.6 /100 | #208 | Poor 12.5% |
| Immigrants | Sierra Leone | 12.9 /100 | #209 | Poor 12.5% |
| Immigrants | Uruguay | 12.8 /100 | #210 | Poor 12.5% |
| Colombians | 10.2 /100 | #211 | Poor 12.6% |
| Malaysians | 8.5 /100 | #212 | Tragic 12.7% |
| Moroccans | 7.6 /100 | #213 | Tragic 12.8% |
| Immigrants | Africa | 7.6 /100 | #214 | Tragic 12.8% |
| Native Hawaiians | 6.7 /100 | #215 | Tragic 12.8% |
| Immigrants | South America | 6.5 /100 | #216 | Tragic 12.8% |
| Immigrants | Burma/Myanmar | 6.0 /100 | #217 | Tragic 12.9% |
| Hawaiians | 5.4 /100 | #218 | Tragic 12.9% |
| Immigrants | Middle Africa | 5.4 /100 | #219 | Tragic 12.9% |
| Immigrants | Colombia | 5.3 /100 | #220 | Tragic 12.9% |