Immigrants from Costa Rica vs Soviet Union Receiving Food Stamps
COMPARE
Immigrants from Costa Rica
Soviet Union
Receiving Food Stamps
Receiving Food Stamps Comparison
Immigrants from Costa Rica
Soviet Union
12.2%
RECEIVING FOOD STAMPS
25.4/ 100
METRIC RATING
198th/ 347
METRIC RANK
11.1%
RECEIVING FOOD STAMPS
83.1/ 100
METRIC RATING
150th/ 347
METRIC RANK
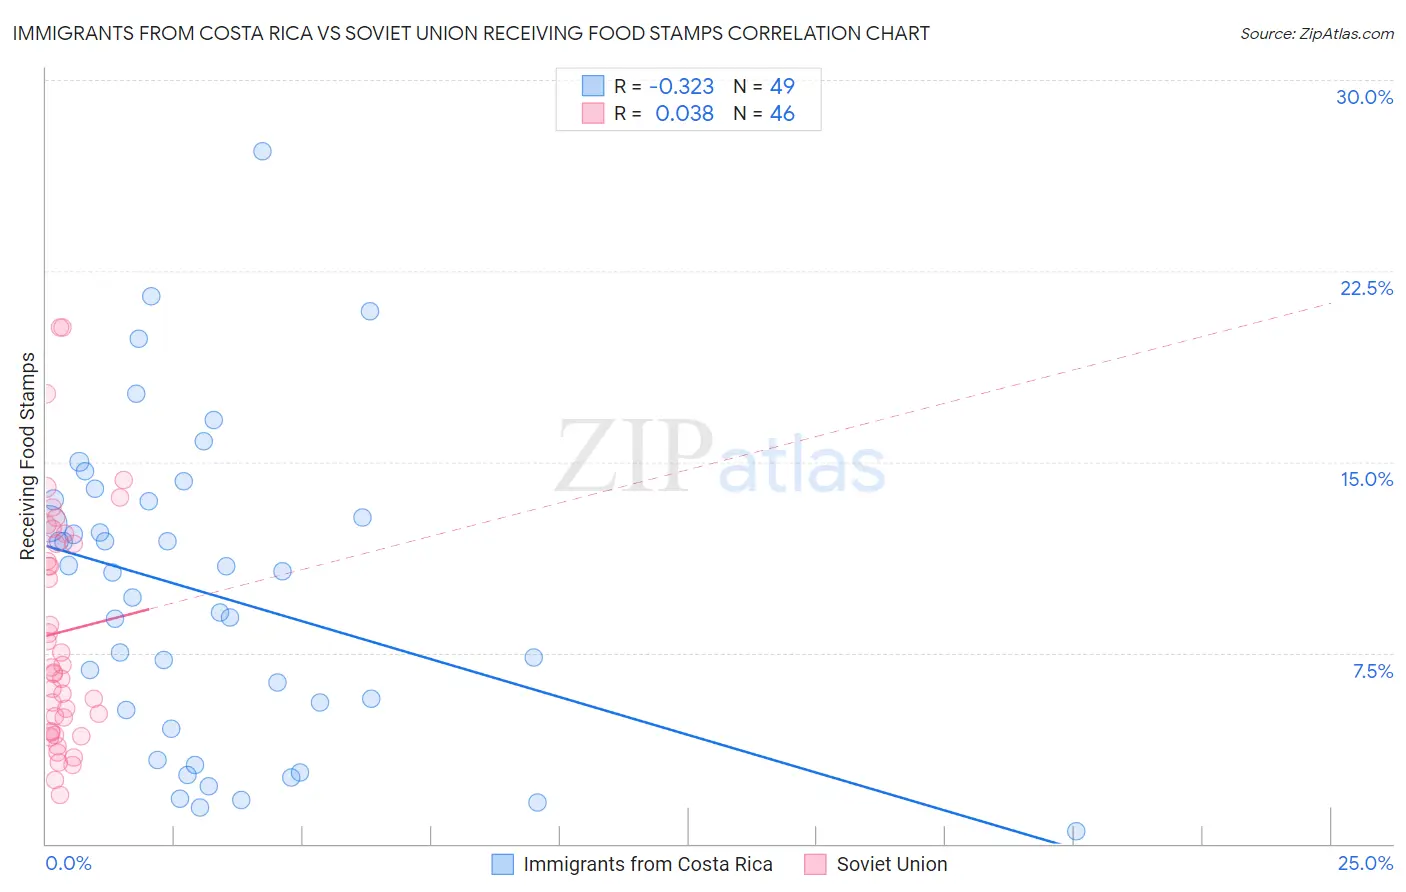
Immigrants from Costa Rica vs Soviet Union Receiving Food Stamps Correlation Chart
The statistical analysis conducted on geographies consisting of 204,093,870 people shows a mild negative correlation between the proportion of Immigrants from Costa Rica and percentage of population receiving government assistance and/or food stamps in the United States with a correlation coefficient (R) of -0.323 and weighted average of 12.2%. Similarly, the statistical analysis conducted on geographies consisting of 43,471,584 people shows no correlation between the proportion of Soviet Union and percentage of population receiving government assistance and/or food stamps in the United States with a correlation coefficient (R) of 0.038 and weighted average of 11.1%, a difference of 9.9%.
Receiving Food Stamps Correlation Summary
| Measurement | Immigrants from Costa Rica | Soviet Union |
| Minimum | 0.50% | 1.9% |
| Maximum | 27.2% | 20.3% |
| Range | 26.7% | 18.4% |
| Mean | 9.8% | 8.3% |
| Median | 10.7% | 6.8% |
| Interquartile 25% (IQ1) | 4.9% | 4.4% |
| Interquartile 75% (IQ3) | 13.5% | 11.8% |
| Interquartile Range (IQR) | 8.6% | 7.4% |
| Standard Deviation (Sample) | 6.0% | 4.6% |
| Standard Deviation (Population) | 6.0% | 4.6% |
Similar Demographics by Receiving Food Stamps
Demographics Similar to Immigrants from Costa Rica by Receiving Food Stamps
In terms of receiving food stamps, the demographic groups most similar to Immigrants from Costa Rica are Portuguese (12.2%, a difference of 0.050%), Delaware (12.2%, a difference of 0.13%), Iraqi (12.2%, a difference of 0.21%), American (12.2%, a difference of 0.24%), and Immigrants from Sudan (12.1%, a difference of 0.30%).
| Demographics | Rating | Rank | Receiving Food Stamps |
| Venezuelans | 32.1 /100 | #191 | Fair 12.0% |
| Samoans | 31.0 /100 | #192 | Fair 12.1% |
| Immigrants | Fiji | 27.8 /100 | #193 | Fair 12.1% |
| Immigrants | Sudan | 27.1 /100 | #194 | Fair 12.1% |
| Americans | 26.7 /100 | #195 | Fair 12.2% |
| Iraqis | 26.6 /100 | #196 | Fair 12.2% |
| Delaware | 26.1 /100 | #197 | Fair 12.2% |
| Immigrants | Costa Rica | 25.4 /100 | #198 | Fair 12.2% |
| Portuguese | 25.1 /100 | #199 | Fair 12.2% |
| Sierra Leoneans | 23.6 /100 | #200 | Fair 12.2% |
| Ugandans | 22.5 /100 | #201 | Fair 12.2% |
| Immigrants | Venezuela | 20.1 /100 | #202 | Fair 12.3% |
| Shoshone | 17.7 /100 | #203 | Poor 12.4% |
| Immigrants | Nonimmigrants | 17.6 /100 | #204 | Poor 12.4% |
| Aleuts | 17.3 /100 | #205 | Poor 12.4% |
Demographics Similar to Soviet Union by Receiving Food Stamps
In terms of receiving food stamps, the demographic groups most similar to Soviet Union are Brazilian (11.1%, a difference of 0.020%), Immigrants from South Eastern Asia (11.1%, a difference of 0.040%), White/Caucasian (11.1%, a difference of 0.21%), Taiwanese (11.0%, a difference of 0.30%), and Immigrants from Spain (11.1%, a difference of 0.36%).
| Demographics | Rating | Rank | Receiving Food Stamps |
| Immigrants | Northern Africa | 86.0 /100 | #143 | Excellent 11.0% |
| Syrians | 85.5 /100 | #144 | Excellent 11.0% |
| Hungarians | 85.1 /100 | #145 | Excellent 11.0% |
| Taiwanese | 84.2 /100 | #146 | Excellent 11.0% |
| Whites/Caucasians | 83.9 /100 | #147 | Excellent 11.1% |
| Immigrants | South Eastern Asia | 83.3 /100 | #148 | Excellent 11.1% |
| Brazilians | 83.2 /100 | #149 | Excellent 11.1% |
| Soviet Union | 83.1 /100 | #150 | Excellent 11.1% |
| Immigrants | Spain | 81.7 /100 | #151 | Excellent 11.1% |
| Immigrants | Kazakhstan | 81.7 /100 | #152 | Excellent 11.1% |
| Lebanese | 81.6 /100 | #153 | Excellent 11.1% |
| Armenians | 81.4 /100 | #154 | Excellent 11.1% |
| Immigrants | Argentina | 80.4 /100 | #155 | Excellent 11.2% |
| Immigrants | Afghanistan | 75.6 /100 | #156 | Good 11.3% |
| Immigrants | Lebanon | 75.2 /100 | #157 | Good 11.3% |