Apache vs Immigrants from Barbados Receiving Food Stamps
COMPARE
Apache
Immigrants from Barbados
Receiving Food Stamps
Receiving Food Stamps Comparison
Apache
Immigrants from Barbados
18.3%
RECEIVING FOOD STAMPS
0.0/ 100
METRIC RATING
327th/ 347
METRIC RANK
16.6%
RECEIVING FOOD STAMPS
0.0/ 100
METRIC RATING
310th/ 347
METRIC RANK
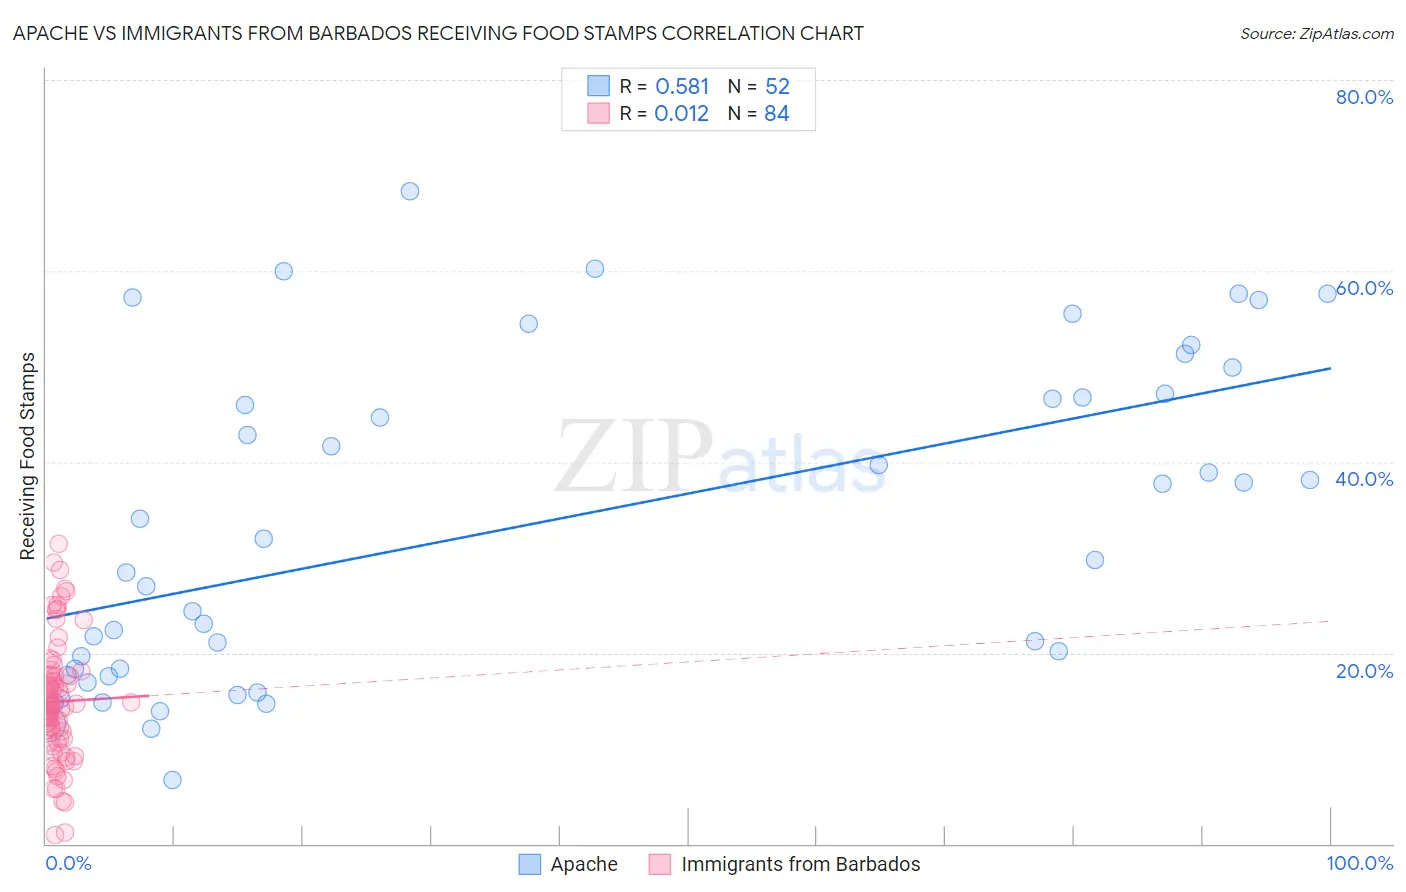
Apache vs Immigrants from Barbados Receiving Food Stamps Correlation Chart
The statistical analysis conducted on geographies consisting of 230,963,565 people shows a substantial positive correlation between the proportion of Apache and percentage of population receiving government assistance and/or food stamps in the United States with a correlation coefficient (R) of 0.581 and weighted average of 18.3%. Similarly, the statistical analysis conducted on geographies consisting of 112,654,620 people shows no correlation between the proportion of Immigrants from Barbados and percentage of population receiving government assistance and/or food stamps in the United States with a correlation coefficient (R) of 0.012 and weighted average of 16.6%, a difference of 10.0%.
Receiving Food Stamps Correlation Summary
| Measurement | Apache | Immigrants from Barbados |
| Minimum | 6.6% | 0.90% |
| Maximum | 68.4% | 31.4% |
| Range | 61.8% | 30.5% |
| Mean | 33.4% | 14.9% |
| Median | 30.8% | 14.5% |
| Interquartile 25% (IQ1) | 18.0% | 11.0% |
| Interquartile 75% (IQ3) | 47.0% | 17.6% |
| Interquartile Range (IQR) | 29.0% | 6.6% |
| Standard Deviation (Sample) | 16.8% | 6.2% |
| Standard Deviation (Population) | 16.6% | 6.2% |
Demographics Similar to Apache and Immigrants from Barbados by Receiving Food Stamps
In terms of receiving food stamps, the demographic groups most similar to Apache are Colville (18.3%, a difference of 0.21%), Cuban (18.2%, a difference of 0.31%), Immigrants from Haiti (18.2%, a difference of 0.42%), British West Indian (17.9%, a difference of 2.2%), and Immigrants from Grenada (17.8%, a difference of 2.8%). Similarly, the demographic groups most similar to Immigrants from Barbados are Guyanese (16.7%, a difference of 0.52%), U.S. Virgin Islander (16.5%, a difference of 0.56%), Barbadian (16.5%, a difference of 0.79%), Sioux (16.8%, a difference of 1.2%), and Immigrants from Jamaica (16.9%, a difference of 1.5%).
| Demographics | Rating | Rank | Receiving Food Stamps |
| Barbadians | 0.0 /100 | #308 | Tragic 16.5% |
| U.S. Virgin Islanders | 0.0 /100 | #309 | Tragic 16.5% |
| Immigrants | Barbados | 0.0 /100 | #310 | Tragic 16.6% |
| Guyanese | 0.0 /100 | #311 | Tragic 16.7% |
| Sioux | 0.0 /100 | #312 | Tragic 16.8% |
| Immigrants | Jamaica | 0.0 /100 | #313 | Tragic 16.9% |
| Immigrants | Guyana | 0.0 /100 | #314 | Tragic 16.9% |
| Bahamians | 0.0 /100 | #315 | Tragic 17.0% |
| Central American Indians | 0.0 /100 | #316 | Tragic 17.1% |
| Blacks/African Americans | 0.0 /100 | #317 | Tragic 17.2% |
| Menominee | 0.0 /100 | #318 | Tragic 17.2% |
| Immigrants | St. Vincent and the Grenadines | 0.0 /100 | #319 | Tragic 17.2% |
| Immigrants | Nicaragua | 0.0 /100 | #320 | Tragic 17.2% |
| Natives/Alaskans | 0.0 /100 | #321 | Tragic 17.3% |
| Immigrants | Grenada | 0.0 /100 | #322 | Tragic 17.8% |
| Haitians | 0.0 /100 | #323 | Tragic 17.8% |
| British West Indians | 0.0 /100 | #324 | Tragic 17.9% |
| Immigrants | Haiti | 0.0 /100 | #325 | Tragic 18.2% |
| Cubans | 0.0 /100 | #326 | Tragic 18.2% |
| Apache | 0.0 /100 | #327 | Tragic 18.3% |
| Colville | 0.0 /100 | #328 | Tragic 18.3% |