Apache vs Immigrants from Greece Receiving Food Stamps
COMPARE
Apache
Immigrants from Greece
Receiving Food Stamps
Receiving Food Stamps Comparison
Apache
Immigrants from Greece
18.3%
RECEIVING FOOD STAMPS
0.0/ 100
METRIC RATING
327th/ 347
METRIC RANK
10.3%
RECEIVING FOOD STAMPS
97.4/ 100
METRIC RATING
94th/ 347
METRIC RANK
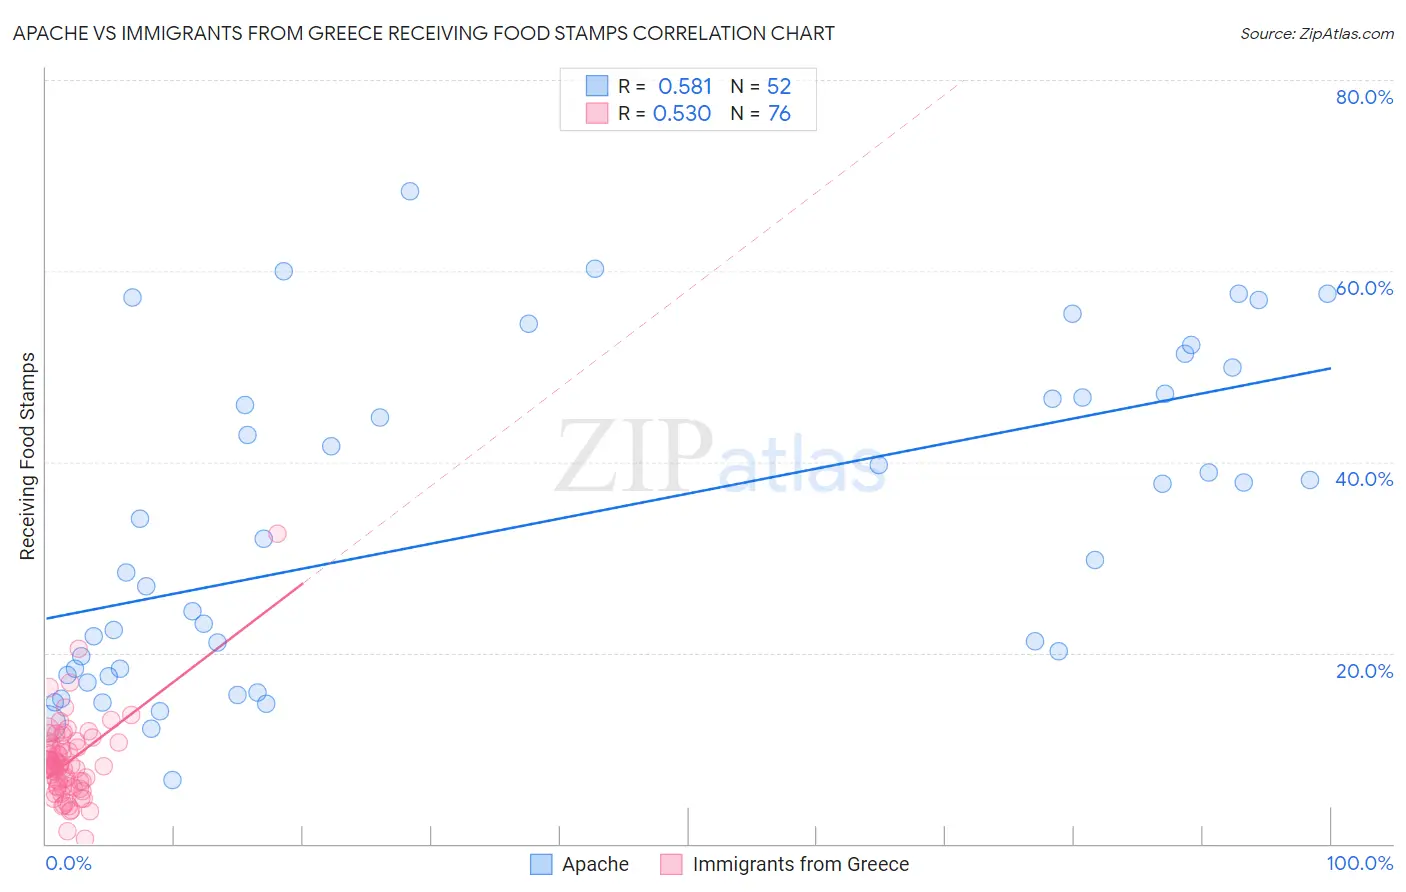
Apache vs Immigrants from Greece Receiving Food Stamps Correlation Chart
The statistical analysis conducted on geographies consisting of 230,963,565 people shows a substantial positive correlation between the proportion of Apache and percentage of population receiving government assistance and/or food stamps in the United States with a correlation coefficient (R) of 0.581 and weighted average of 18.3%. Similarly, the statistical analysis conducted on geographies consisting of 216,550,316 people shows a substantial positive correlation between the proportion of Immigrants from Greece and percentage of population receiving government assistance and/or food stamps in the United States with a correlation coefficient (R) of 0.530 and weighted average of 10.3%, a difference of 78.3%.
Receiving Food Stamps Correlation Summary
| Measurement | Apache | Immigrants from Greece |
| Minimum | 6.6% | 0.50% |
| Maximum | 68.4% | 32.5% |
| Range | 61.8% | 32.0% |
| Mean | 33.4% | 8.6% |
| Median | 30.8% | 8.2% |
| Interquartile 25% (IQ1) | 18.0% | 6.0% |
| Interquartile 75% (IQ3) | 47.0% | 10.5% |
| Interquartile Range (IQR) | 29.0% | 4.5% |
| Standard Deviation (Sample) | 16.8% | 4.4% |
| Standard Deviation (Population) | 16.6% | 4.4% |
Similar Demographics by Receiving Food Stamps
Demographics Similar to Apache by Receiving Food Stamps
In terms of receiving food stamps, the demographic groups most similar to Apache are Colville (18.3%, a difference of 0.21%), Cuban (18.2%, a difference of 0.31%), Immigrants from Haiti (18.2%, a difference of 0.42%), Immigrants from Dominica (18.4%, a difference of 0.67%), and British West Indian (17.9%, a difference of 2.2%).
| Demographics | Rating | Rank | Receiving Food Stamps |
| Immigrants | Nicaragua | 0.0 /100 | #320 | Tragic 17.2% |
| Natives/Alaskans | 0.0 /100 | #321 | Tragic 17.3% |
| Immigrants | Grenada | 0.0 /100 | #322 | Tragic 17.8% |
| Haitians | 0.0 /100 | #323 | Tragic 17.8% |
| British West Indians | 0.0 /100 | #324 | Tragic 17.9% |
| Immigrants | Haiti | 0.0 /100 | #325 | Tragic 18.2% |
| Cubans | 0.0 /100 | #326 | Tragic 18.2% |
| Apache | 0.0 /100 | #327 | Tragic 18.3% |
| Colville | 0.0 /100 | #328 | Tragic 18.3% |
| Immigrants | Dominica | 0.0 /100 | #329 | Tragic 18.4% |
| Pima | 0.0 /100 | #330 | Tragic 19.0% |
| Immigrants | Caribbean | 0.0 /100 | #331 | Tragic 19.6% |
| Pueblo | 0.0 /100 | #332 | Tragic 19.9% |
| Inupiat | 0.0 /100 | #333 | Tragic 20.1% |
| Yuman | 0.0 /100 | #334 | Tragic 20.2% |
Demographics Similar to Immigrants from Greece by Receiving Food Stamps
In terms of receiving food stamps, the demographic groups most similar to Immigrants from Greece are Basque (10.3%, a difference of 0.030%), Welsh (10.3%, a difference of 0.080%), Czechoslovakian (10.3%, a difference of 0.34%), Immigrants from Egypt (10.3%, a difference of 0.39%), and Belgian (10.2%, a difference of 0.53%).
| Demographics | Rating | Rank | Receiving Food Stamps |
| Egyptians | 98.4 /100 | #87 | Exceptional 10.0% |
| Immigrants | Kuwait | 98.4 /100 | #88 | Exceptional 10.0% |
| Immigrants | France | 98.3 /100 | #89 | Exceptional 10.1% |
| Finns | 97.9 /100 | #90 | Exceptional 10.2% |
| Jordanians | 97.9 /100 | #91 | Exceptional 10.2% |
| Irish | 97.9 /100 | #92 | Exceptional 10.2% |
| Belgians | 97.7 /100 | #93 | Exceptional 10.2% |
| Immigrants | Greece | 97.4 /100 | #94 | Exceptional 10.3% |
| Basques | 97.4 /100 | #95 | Exceptional 10.3% |
| Welsh | 97.3 /100 | #96 | Exceptional 10.3% |
| Czechoslovakians | 97.2 /100 | #97 | Exceptional 10.3% |
| Immigrants | Egypt | 97.1 /100 | #98 | Exceptional 10.3% |
| Serbians | 97.0 /100 | #99 | Exceptional 10.3% |
| Immigrants | Western Europe | 96.9 /100 | #100 | Exceptional 10.3% |
| Palestinians | 96.9 /100 | #101 | Exceptional 10.3% |