Apache vs Alsatian Receiving Food Stamps
COMPARE
Apache
Alsatian
Receiving Food Stamps
Receiving Food Stamps Comparison
Apache
Alsatians
18.3%
RECEIVING FOOD STAMPS
0.0/ 100
METRIC RATING
327th/ 347
METRIC RANK
11.4%
RECEIVING FOOD STAMPS
68.0/ 100
METRIC RATING
162nd/ 347
METRIC RANK
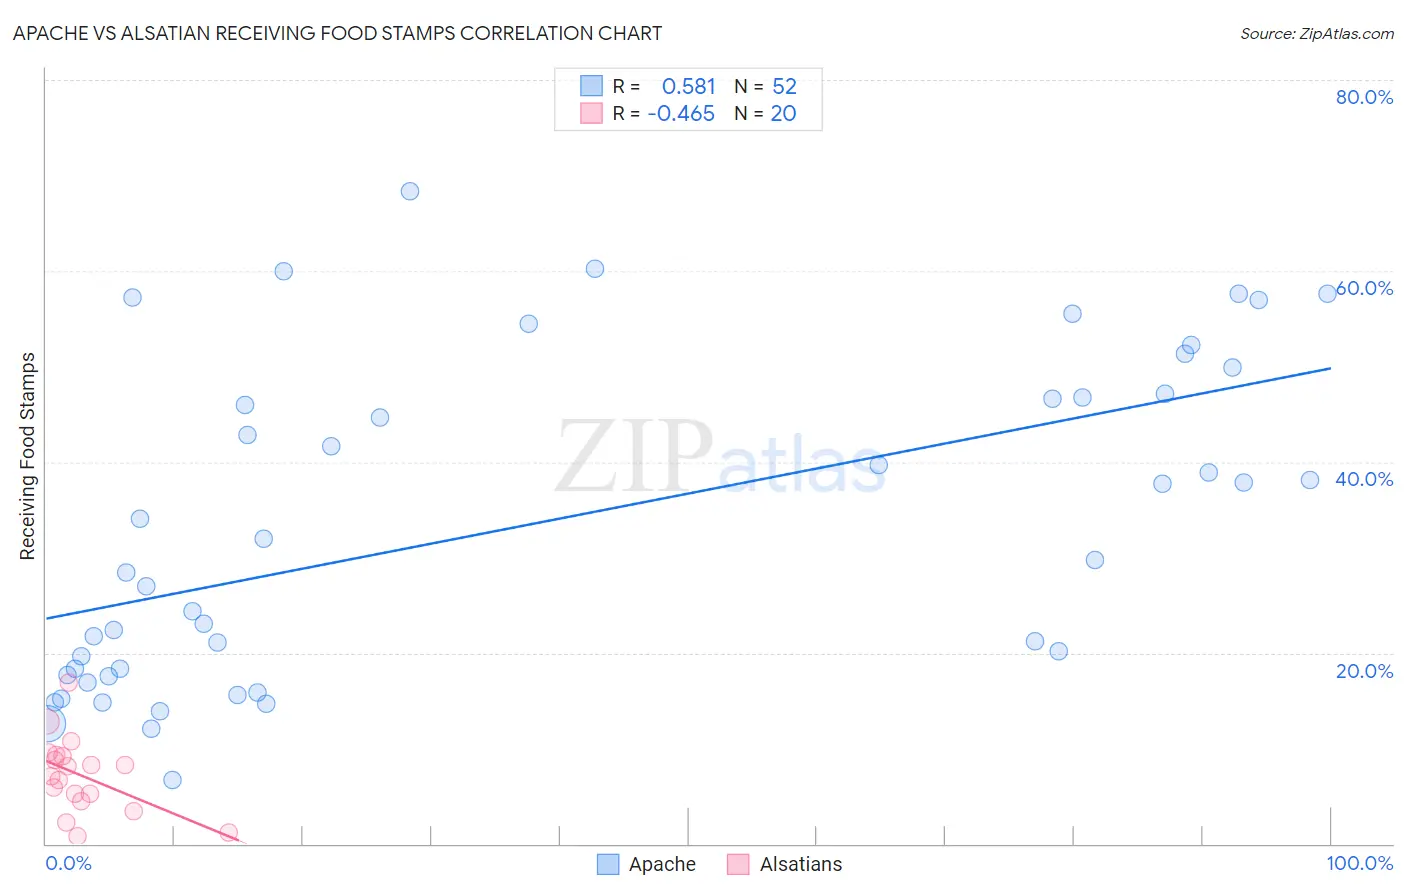
Apache vs Alsatian Receiving Food Stamps Correlation Chart
The statistical analysis conducted on geographies consisting of 230,963,565 people shows a substantial positive correlation between the proportion of Apache and percentage of population receiving government assistance and/or food stamps in the United States with a correlation coefficient (R) of 0.581 and weighted average of 18.3%. Similarly, the statistical analysis conducted on geographies consisting of 82,623,919 people shows a moderate negative correlation between the proportion of Alsatians and percentage of population receiving government assistance and/or food stamps in the United States with a correlation coefficient (R) of -0.465 and weighted average of 11.4%, a difference of 60.0%.
Receiving Food Stamps Correlation Summary
| Measurement | Apache | Alsatian |
| Minimum | 6.6% | 0.80% |
| Maximum | 68.4% | 16.9% |
| Range | 61.8% | 16.1% |
| Mean | 33.4% | 7.2% |
| Median | 30.8% | 7.6% |
| Interquartile 25% (IQ1) | 18.0% | 4.8% |
| Interquartile 75% (IQ3) | 47.0% | 9.2% |
| Interquartile Range (IQR) | 29.0% | 4.4% |
| Standard Deviation (Sample) | 16.8% | 3.9% |
| Standard Deviation (Population) | 16.6% | 3.8% |
Similar Demographics by Receiving Food Stamps
Demographics Similar to Apache by Receiving Food Stamps
In terms of receiving food stamps, the demographic groups most similar to Apache are Colville (18.3%, a difference of 0.21%), Cuban (18.2%, a difference of 0.31%), Immigrants from Haiti (18.2%, a difference of 0.42%), Immigrants from Dominica (18.4%, a difference of 0.67%), and British West Indian (17.9%, a difference of 2.2%).
| Demographics | Rating | Rank | Receiving Food Stamps |
| Immigrants | Nicaragua | 0.0 /100 | #320 | Tragic 17.2% |
| Natives/Alaskans | 0.0 /100 | #321 | Tragic 17.3% |
| Immigrants | Grenada | 0.0 /100 | #322 | Tragic 17.8% |
| Haitians | 0.0 /100 | #323 | Tragic 17.8% |
| British West Indians | 0.0 /100 | #324 | Tragic 17.9% |
| Immigrants | Haiti | 0.0 /100 | #325 | Tragic 18.2% |
| Cubans | 0.0 /100 | #326 | Tragic 18.2% |
| Apache | 0.0 /100 | #327 | Tragic 18.3% |
| Colville | 0.0 /100 | #328 | Tragic 18.3% |
| Immigrants | Dominica | 0.0 /100 | #329 | Tragic 18.4% |
| Pima | 0.0 /100 | #330 | Tragic 19.0% |
| Immigrants | Caribbean | 0.0 /100 | #331 | Tragic 19.6% |
| Pueblo | 0.0 /100 | #332 | Tragic 19.9% |
| Inupiat | 0.0 /100 | #333 | Tragic 20.1% |
| Yuman | 0.0 /100 | #334 | Tragic 20.2% |
Demographics Similar to Alsatians by Receiving Food Stamps
In terms of receiving food stamps, the demographic groups most similar to Alsatians are Pennsylvania German (11.4%, a difference of 0.060%), French Canadian (11.4%, a difference of 0.25%), Immigrants from Southern Europe (11.5%, a difference of 0.37%), Immigrants from Oceania (11.4%, a difference of 0.41%), and Immigrants from Chile (11.5%, a difference of 0.48%).
| Demographics | Rating | Rank | Receiving Food Stamps |
| Immigrants | Argentina | 80.4 /100 | #155 | Excellent 11.2% |
| Immigrants | Afghanistan | 75.6 /100 | #156 | Good 11.3% |
| Immigrants | Lebanon | 75.2 /100 | #157 | Good 11.3% |
| Immigrants | Bosnia and Herzegovina | 72.6 /100 | #158 | Good 11.3% |
| Immigrants | Oceania | 70.4 /100 | #159 | Good 11.4% |
| French Canadians | 69.5 /100 | #160 | Good 11.4% |
| Pennsylvania Germans | 68.4 /100 | #161 | Good 11.4% |
| Alsatians | 68.0 /100 | #162 | Good 11.4% |
| Immigrants | Southern Europe | 65.8 /100 | #163 | Good 11.5% |
| Immigrants | Chile | 65.0 /100 | #164 | Good 11.5% |
| Arabs | 64.7 /100 | #165 | Good 11.5% |
| Immigrants | Belarus | 62.8 /100 | #166 | Good 11.5% |
| Kenyans | 60.2 /100 | #167 | Good 11.6% |
| Tlingit-Haida | 59.1 /100 | #168 | Average 11.6% |
| Immigrants | Eastern Africa | 58.3 /100 | #169 | Average 11.6% |