Apache vs Swiss Receiving Food Stamps
COMPARE
Apache
Swiss
Receiving Food Stamps
Receiving Food Stamps Comparison
Apache
Swiss
18.3%
RECEIVING FOOD STAMPS
0.0/ 100
METRIC RATING
327th/ 347
METRIC RANK
9.7%
RECEIVING FOOD STAMPS
99.3/ 100
METRIC RATING
54th/ 347
METRIC RANK
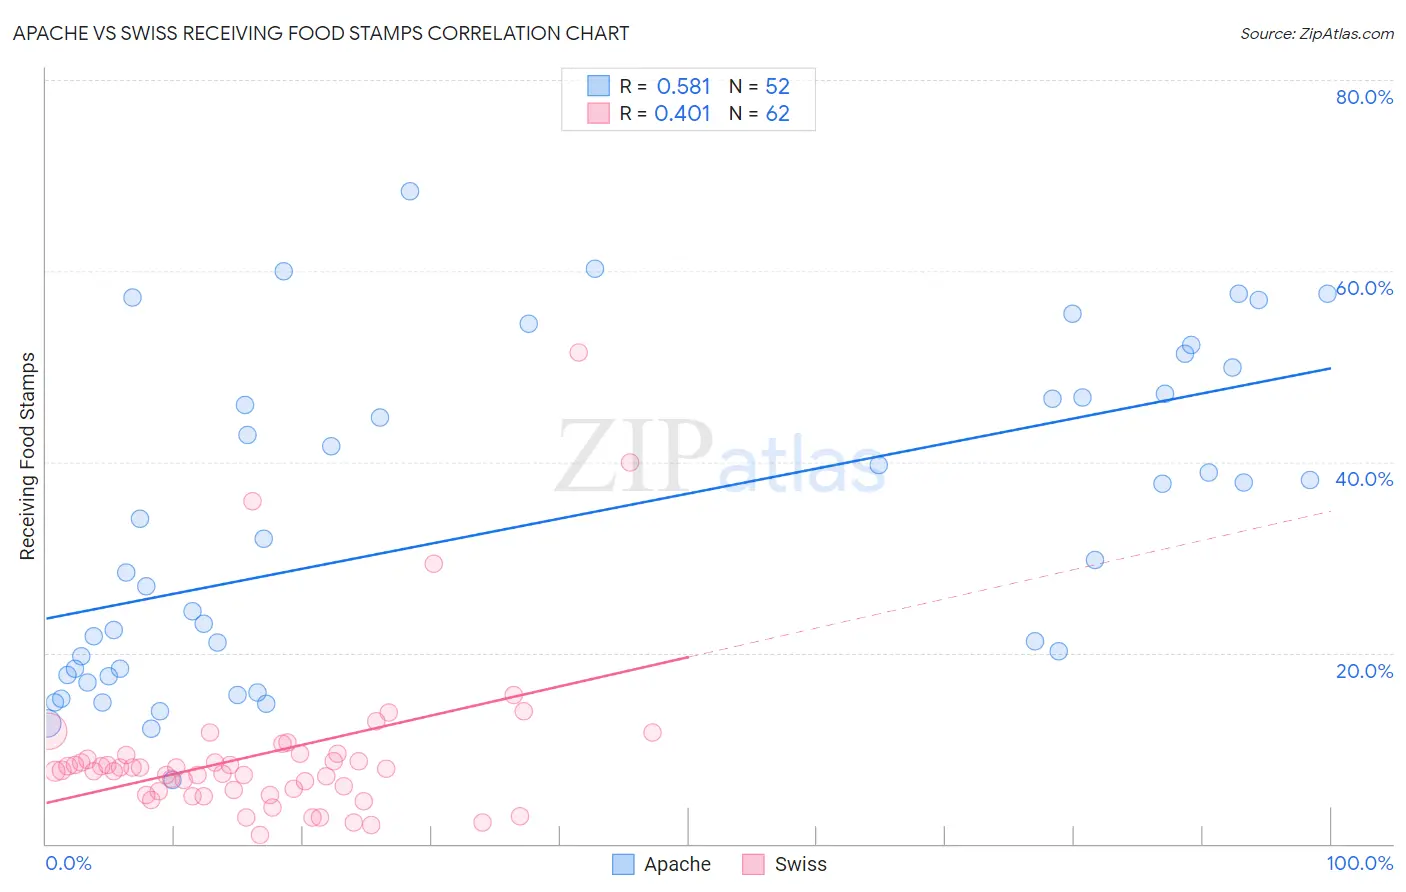
Apache vs Swiss Receiving Food Stamps Correlation Chart
The statistical analysis conducted on geographies consisting of 230,963,565 people shows a substantial positive correlation between the proportion of Apache and percentage of population receiving government assistance and/or food stamps in the United States with a correlation coefficient (R) of 0.581 and weighted average of 18.3%. Similarly, the statistical analysis conducted on geographies consisting of 463,160,443 people shows a moderate positive correlation between the proportion of Swiss and percentage of population receiving government assistance and/or food stamps in the United States with a correlation coefficient (R) of 0.401 and weighted average of 9.7%, a difference of 88.5%.
Receiving Food Stamps Correlation Summary
| Measurement | Apache | Swiss |
| Minimum | 6.6% | 0.90% |
| Maximum | 68.4% | 51.5% |
| Range | 61.8% | 50.6% |
| Mean | 33.4% | 9.4% |
| Median | 30.8% | 7.8% |
| Interquartile 25% (IQ1) | 18.0% | 5.5% |
| Interquartile 75% (IQ3) | 47.0% | 9.3% |
| Interquartile Range (IQR) | 29.0% | 3.9% |
| Standard Deviation (Sample) | 16.8% | 8.7% |
| Standard Deviation (Population) | 16.6% | 8.6% |
Similar Demographics by Receiving Food Stamps
Demographics Similar to Apache by Receiving Food Stamps
In terms of receiving food stamps, the demographic groups most similar to Apache are Colville (18.3%, a difference of 0.21%), Cuban (18.2%, a difference of 0.31%), Immigrants from Haiti (18.2%, a difference of 0.42%), Immigrants from Dominica (18.4%, a difference of 0.67%), and British West Indian (17.9%, a difference of 2.2%).
| Demographics | Rating | Rank | Receiving Food Stamps |
| Immigrants | Nicaragua | 0.0 /100 | #320 | Tragic 17.2% |
| Natives/Alaskans | 0.0 /100 | #321 | Tragic 17.3% |
| Immigrants | Grenada | 0.0 /100 | #322 | Tragic 17.8% |
| Haitians | 0.0 /100 | #323 | Tragic 17.8% |
| British West Indians | 0.0 /100 | #324 | Tragic 17.9% |
| Immigrants | Haiti | 0.0 /100 | #325 | Tragic 18.2% |
| Cubans | 0.0 /100 | #326 | Tragic 18.2% |
| Apache | 0.0 /100 | #327 | Tragic 18.3% |
| Colville | 0.0 /100 | #328 | Tragic 18.3% |
| Immigrants | Dominica | 0.0 /100 | #329 | Tragic 18.4% |
| Pima | 0.0 /100 | #330 | Tragic 19.0% |
| Immigrants | Caribbean | 0.0 /100 | #331 | Tragic 19.6% |
| Pueblo | 0.0 /100 | #332 | Tragic 19.9% |
| Inupiat | 0.0 /100 | #333 | Tragic 20.1% |
| Yuman | 0.0 /100 | #334 | Tragic 20.2% |
Demographics Similar to Swiss by Receiving Food Stamps
In terms of receiving food stamps, the demographic groups most similar to Swiss are Immigrants from Switzerland (9.7%, a difference of 0.010%), Tongan (9.7%, a difference of 0.12%), Immigrants from South Africa (9.7%, a difference of 0.13%), Asian (9.7%, a difference of 0.15%), and Immigrants from Canada (9.7%, a difference of 0.19%).
| Demographics | Rating | Rank | Receiving Food Stamps |
| Indians (Asian) | 99.4 /100 | #47 | Exceptional 9.6% |
| Russians | 99.4 /100 | #48 | Exceptional 9.6% |
| Immigrants | Czechoslovakia | 99.4 /100 | #49 | Exceptional 9.6% |
| Lithuanians | 99.4 /100 | #50 | Exceptional 9.7% |
| Asians | 99.3 /100 | #51 | Exceptional 9.7% |
| Immigrants | South Africa | 99.3 /100 | #52 | Exceptional 9.7% |
| Tongans | 99.3 /100 | #53 | Exceptional 9.7% |
| Swiss | 99.3 /100 | #54 | Exceptional 9.7% |
| Immigrants | Switzerland | 99.3 /100 | #55 | Exceptional 9.7% |
| Immigrants | Canada | 99.3 /100 | #56 | Exceptional 9.7% |
| Greeks | 99.3 /100 | #57 | Exceptional 9.7% |
| Scandinavians | 99.2 /100 | #58 | Exceptional 9.7% |
| British | 99.2 /100 | #59 | Exceptional 9.7% |
| Germans | 99.2 /100 | #60 | Exceptional 9.7% |
| English | 99.2 /100 | #61 | Exceptional 9.8% |