Apache vs Alaska Native Receiving Food Stamps
COMPARE
Apache
Alaska Native
Receiving Food Stamps
Receiving Food Stamps Comparison
Apache
Alaska Natives
18.3%
RECEIVING FOOD STAMPS
0.0/ 100
METRIC RATING
327th/ 347
METRIC RANK
15.6%
RECEIVING FOOD STAMPS
0.0/ 100
METRIC RATING
292nd/ 347
METRIC RANK
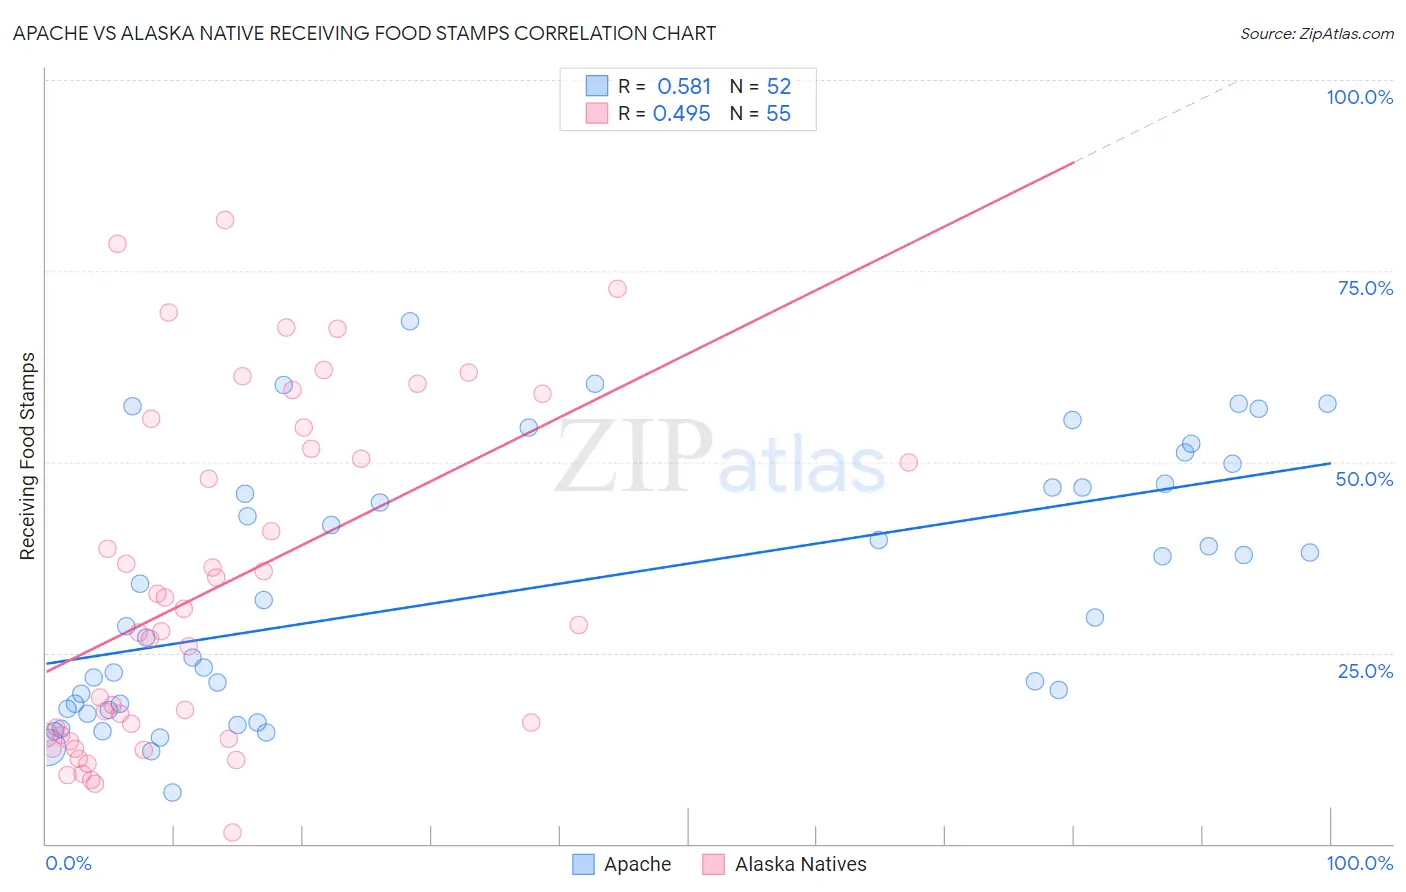
Apache vs Alaska Native Receiving Food Stamps Correlation Chart
The statistical analysis conducted on geographies consisting of 230,963,565 people shows a substantial positive correlation between the proportion of Apache and percentage of population receiving government assistance and/or food stamps in the United States with a correlation coefficient (R) of 0.581 and weighted average of 18.3%. Similarly, the statistical analysis conducted on geographies consisting of 76,703,689 people shows a moderate positive correlation between the proportion of Alaska Natives and percentage of population receiving government assistance and/or food stamps in the United States with a correlation coefficient (R) of 0.495 and weighted average of 15.6%, a difference of 17.1%.
Receiving Food Stamps Correlation Summary
| Measurement | Apache | Alaska Native |
| Minimum | 6.6% | 1.5% |
| Maximum | 68.4% | 81.7% |
| Range | 61.8% | 80.2% |
| Mean | 33.4% | 33.9% |
| Median | 30.8% | 28.6% |
| Interquartile 25% (IQ1) | 18.0% | 14.3% |
| Interquartile 75% (IQ3) | 47.0% | 54.5% |
| Interquartile Range (IQR) | 29.0% | 40.2% |
| Standard Deviation (Sample) | 16.8% | 22.1% |
| Standard Deviation (Population) | 16.6% | 21.9% |
Similar Demographics by Receiving Food Stamps
Demographics Similar to Apache by Receiving Food Stamps
In terms of receiving food stamps, the demographic groups most similar to Apache are Colville (18.3%, a difference of 0.21%), Cuban (18.2%, a difference of 0.31%), Immigrants from Haiti (18.2%, a difference of 0.42%), Immigrants from Dominica (18.4%, a difference of 0.67%), and British West Indian (17.9%, a difference of 2.2%).
| Demographics | Rating | Rank | Receiving Food Stamps |
| Immigrants | Nicaragua | 0.0 /100 | #320 | Tragic 17.2% |
| Natives/Alaskans | 0.0 /100 | #321 | Tragic 17.3% |
| Immigrants | Grenada | 0.0 /100 | #322 | Tragic 17.8% |
| Haitians | 0.0 /100 | #323 | Tragic 17.8% |
| British West Indians | 0.0 /100 | #324 | Tragic 17.9% |
| Immigrants | Haiti | 0.0 /100 | #325 | Tragic 18.2% |
| Cubans | 0.0 /100 | #326 | Tragic 18.2% |
| Apache | 0.0 /100 | #327 | Tragic 18.3% |
| Colville | 0.0 /100 | #328 | Tragic 18.3% |
| Immigrants | Dominica | 0.0 /100 | #329 | Tragic 18.4% |
| Pima | 0.0 /100 | #330 | Tragic 19.0% |
| Immigrants | Caribbean | 0.0 /100 | #331 | Tragic 19.6% |
| Pueblo | 0.0 /100 | #332 | Tragic 19.9% |
| Inupiat | 0.0 /100 | #333 | Tragic 20.1% |
| Yuman | 0.0 /100 | #334 | Tragic 20.2% |
Demographics Similar to Alaska Natives by Receiving Food Stamps
In terms of receiving food stamps, the demographic groups most similar to Alaska Natives are Vietnamese (15.7%, a difference of 0.30%), Immigrants from Latin America (15.7%, a difference of 0.41%), Honduran (15.5%, a difference of 0.44%), Immigrants from Honduras (15.7%, a difference of 0.74%), and Tsimshian (15.7%, a difference of 0.75%).
| Demographics | Rating | Rank | Receiving Food Stamps |
| Immigrants | Liberia | 0.0 /100 | #285 | Tragic 15.1% |
| Africans | 0.0 /100 | #286 | Tragic 15.1% |
| Immigrants | Mexico | 0.0 /100 | #287 | Tragic 15.2% |
| Immigrants | Belize | 0.0 /100 | #288 | Tragic 15.2% |
| Immigrants | Senegal | 0.0 /100 | #289 | Tragic 15.3% |
| Senegalese | 0.0 /100 | #290 | Tragic 15.4% |
| Hondurans | 0.0 /100 | #291 | Tragic 15.5% |
| Alaska Natives | 0.0 /100 | #292 | Tragic 15.6% |
| Vietnamese | 0.0 /100 | #293 | Tragic 15.7% |
| Immigrants | Latin America | 0.0 /100 | #294 | Tragic 15.7% |
| Immigrants | Honduras | 0.0 /100 | #295 | Tragic 15.7% |
| Tsimshian | 0.0 /100 | #296 | Tragic 15.7% |
| Immigrants | Bahamas | 0.0 /100 | #297 | Tragic 15.8% |
| Immigrants | Trinidad and Tobago | 0.0 /100 | #298 | Tragic 15.8% |
| Hispanics or Latinos | 0.0 /100 | #299 | Tragic 15.8% |