Finnish vs Soviet Union Receiving Food Stamps
COMPARE
Finnish
Soviet Union
Receiving Food Stamps
Receiving Food Stamps Comparison
Finns
Soviet Union
10.2%
RECEIVING FOOD STAMPS
97.9/ 100
METRIC RATING
90th/ 347
METRIC RANK
11.1%
RECEIVING FOOD STAMPS
83.1/ 100
METRIC RATING
150th/ 347
METRIC RANK
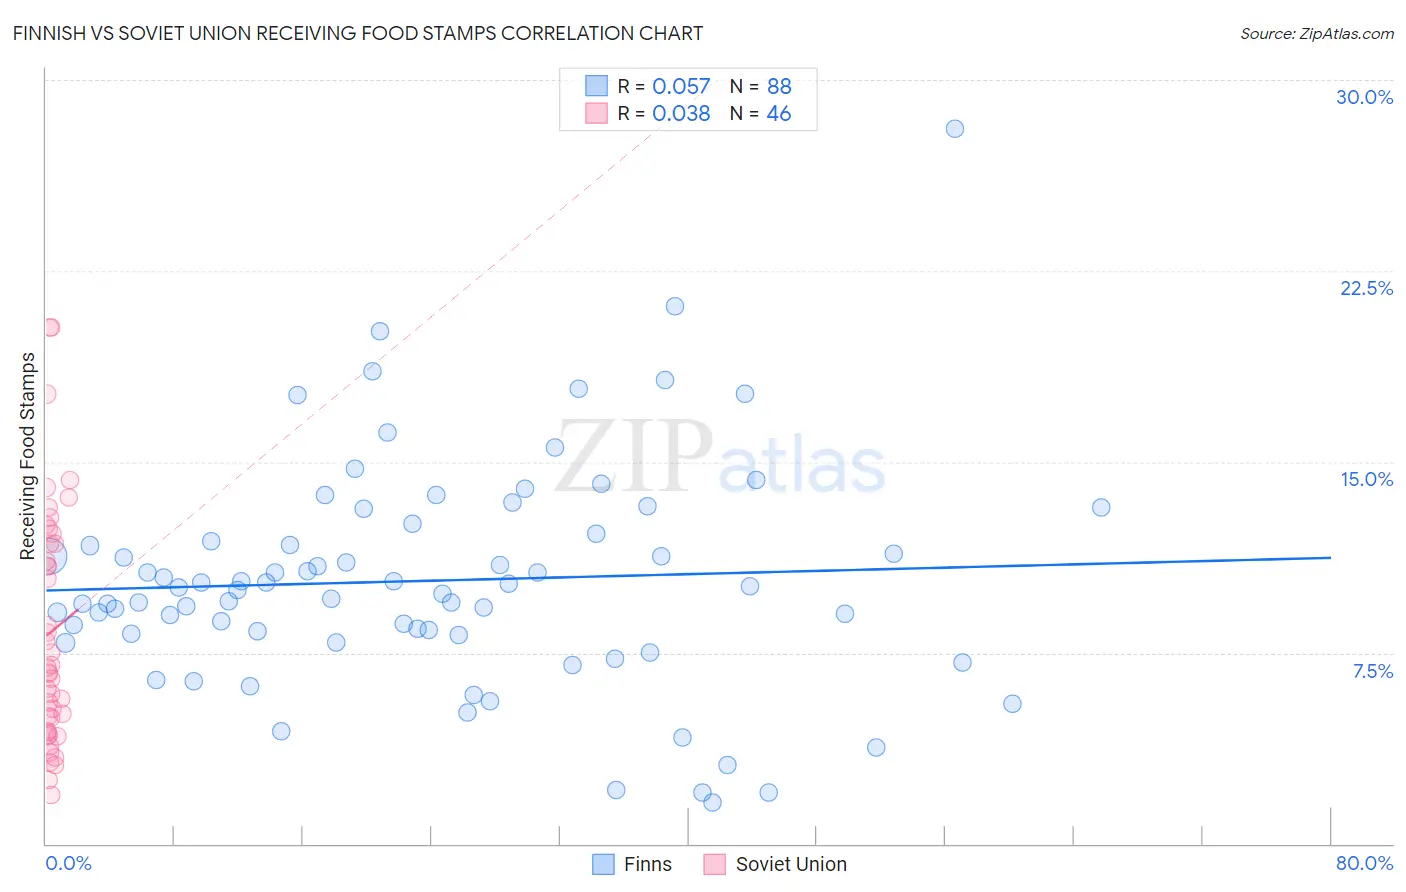
Finnish vs Soviet Union Receiving Food Stamps Correlation Chart
The statistical analysis conducted on geographies consisting of 403,543,220 people shows a slight positive correlation between the proportion of Finns and percentage of population receiving government assistance and/or food stamps in the United States with a correlation coefficient (R) of 0.057 and weighted average of 10.2%. Similarly, the statistical analysis conducted on geographies consisting of 43,471,584 people shows no correlation between the proportion of Soviet Union and percentage of population receiving government assistance and/or food stamps in the United States with a correlation coefficient (R) of 0.038 and weighted average of 11.1%, a difference of 9.1%.
Receiving Food Stamps Correlation Summary
| Measurement | Finnish | Soviet Union |
| Minimum | 1.6% | 1.9% |
| Maximum | 28.1% | 20.3% |
| Range | 26.5% | 18.4% |
| Mean | 10.3% | 8.3% |
| Median | 10.0% | 6.8% |
| Interquartile 25% (IQ1) | 8.2% | 4.4% |
| Interquartile 75% (IQ3) | 12.0% | 11.8% |
| Interquartile Range (IQR) | 3.8% | 7.4% |
| Standard Deviation (Sample) | 4.4% | 4.6% |
| Standard Deviation (Population) | 4.4% | 4.6% |
Similar Demographics by Receiving Food Stamps
Demographics Similar to Finns by Receiving Food Stamps
In terms of receiving food stamps, the demographic groups most similar to Finns are Jordanian (10.2%, a difference of 0.040%), Irish (10.2%, a difference of 0.040%), Belgian (10.2%, a difference of 0.42%), Immigrants from France (10.1%, a difference of 0.85%), and Immigrants from Greece (10.3%, a difference of 0.95%).
| Demographics | Rating | Rank | Receiving Food Stamps |
| Dutch | 98.6 /100 | #83 | Exceptional 10.0% |
| Immigrants | Israel | 98.5 /100 | #84 | Exceptional 10.0% |
| Immigrants | Romania | 98.5 /100 | #85 | Exceptional 10.0% |
| Immigrants | Norway | 98.4 /100 | #86 | Exceptional 10.0% |
| Egyptians | 98.4 /100 | #87 | Exceptional 10.0% |
| Immigrants | Kuwait | 98.4 /100 | #88 | Exceptional 10.0% |
| Immigrants | France | 98.3 /100 | #89 | Exceptional 10.1% |
| Finns | 97.9 /100 | #90 | Exceptional 10.2% |
| Jordanians | 97.9 /100 | #91 | Exceptional 10.2% |
| Irish | 97.9 /100 | #92 | Exceptional 10.2% |
| Belgians | 97.7 /100 | #93 | Exceptional 10.2% |
| Immigrants | Greece | 97.4 /100 | #94 | Exceptional 10.3% |
| Basques | 97.4 /100 | #95 | Exceptional 10.3% |
| Welsh | 97.3 /100 | #96 | Exceptional 10.3% |
| Czechoslovakians | 97.2 /100 | #97 | Exceptional 10.3% |
Demographics Similar to Soviet Union by Receiving Food Stamps
In terms of receiving food stamps, the demographic groups most similar to Soviet Union are Brazilian (11.1%, a difference of 0.020%), Immigrants from South Eastern Asia (11.1%, a difference of 0.040%), White/Caucasian (11.1%, a difference of 0.21%), Taiwanese (11.0%, a difference of 0.30%), and Immigrants from Spain (11.1%, a difference of 0.36%).
| Demographics | Rating | Rank | Receiving Food Stamps |
| Immigrants | Northern Africa | 86.0 /100 | #143 | Excellent 11.0% |
| Syrians | 85.5 /100 | #144 | Excellent 11.0% |
| Hungarians | 85.1 /100 | #145 | Excellent 11.0% |
| Taiwanese | 84.2 /100 | #146 | Excellent 11.0% |
| Whites/Caucasians | 83.9 /100 | #147 | Excellent 11.1% |
| Immigrants | South Eastern Asia | 83.3 /100 | #148 | Excellent 11.1% |
| Brazilians | 83.2 /100 | #149 | Excellent 11.1% |
| Soviet Union | 83.1 /100 | #150 | Excellent 11.1% |
| Immigrants | Spain | 81.7 /100 | #151 | Excellent 11.1% |
| Immigrants | Kazakhstan | 81.7 /100 | #152 | Excellent 11.1% |
| Lebanese | 81.6 /100 | #153 | Excellent 11.1% |
| Armenians | 81.4 /100 | #154 | Excellent 11.1% |
| Immigrants | Argentina | 80.4 /100 | #155 | Excellent 11.2% |
| Immigrants | Afghanistan | 75.6 /100 | #156 | Good 11.3% |
| Immigrants | Lebanon | 75.2 /100 | #157 | Good 11.3% |