Apache vs Immigrants from Vietnam Receiving Food Stamps
COMPARE
Apache
Immigrants from Vietnam
Receiving Food Stamps
Receiving Food Stamps Comparison
Apache
Immigrants from Vietnam
18.3%
RECEIVING FOOD STAMPS
0.0/ 100
METRIC RATING
327th/ 347
METRIC RANK
11.0%
RECEIVING FOOD STAMPS
86.7/ 100
METRIC RATING
141st/ 347
METRIC RANK
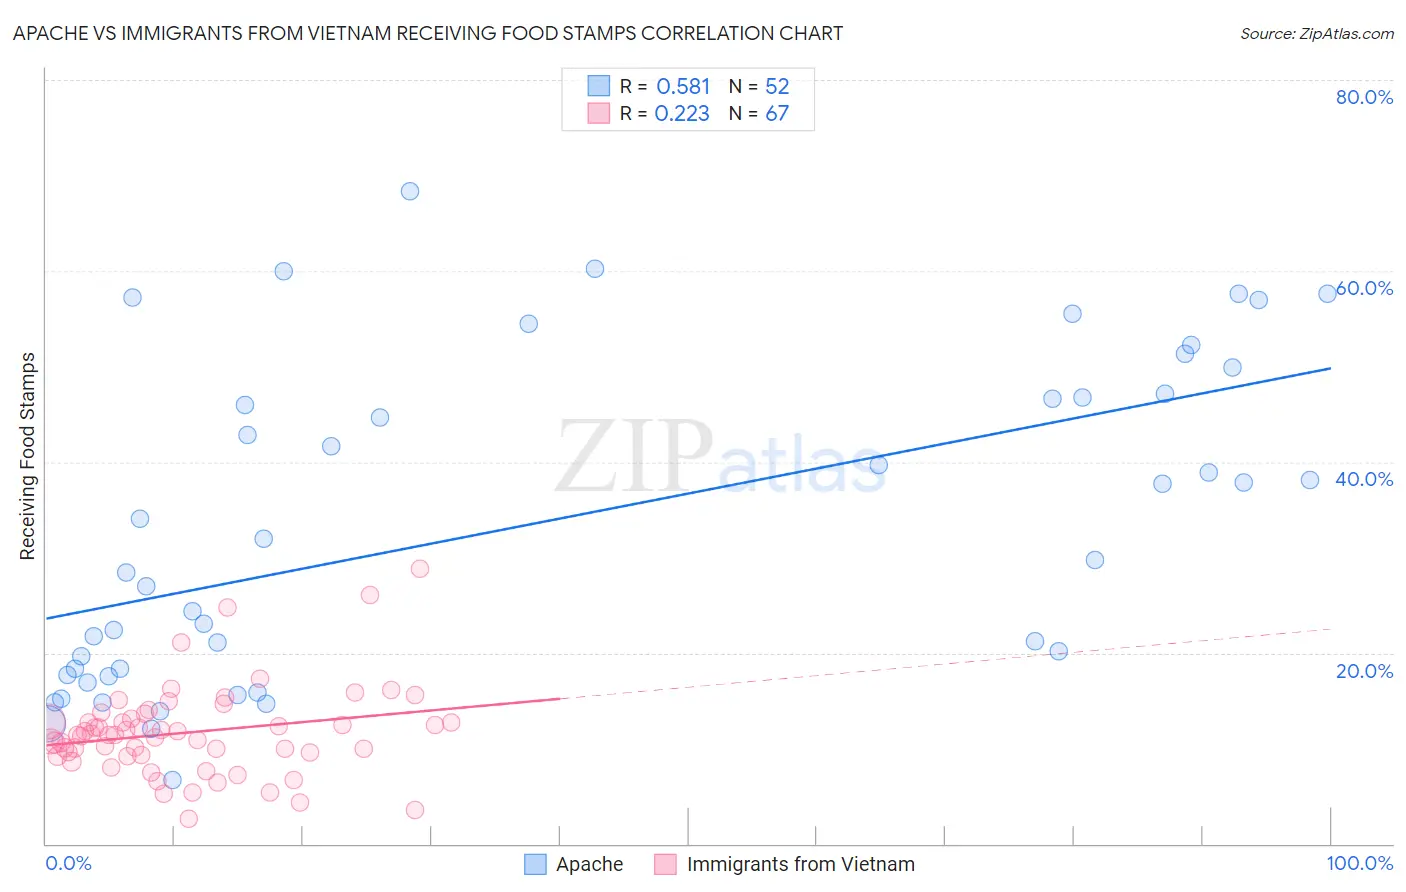
Apache vs Immigrants from Vietnam Receiving Food Stamps Correlation Chart
The statistical analysis conducted on geographies consisting of 230,963,565 people shows a substantial positive correlation between the proportion of Apache and percentage of population receiving government assistance and/or food stamps in the United States with a correlation coefficient (R) of 0.581 and weighted average of 18.3%. Similarly, the statistical analysis conducted on geographies consisting of 403,877,028 people shows a weak positive correlation between the proportion of Immigrants from Vietnam and percentage of population receiving government assistance and/or food stamps in the United States with a correlation coefficient (R) of 0.223 and weighted average of 11.0%, a difference of 66.7%.
Receiving Food Stamps Correlation Summary
| Measurement | Apache | Immigrants from Vietnam |
| Minimum | 6.6% | 2.6% |
| Maximum | 68.4% | 28.8% |
| Range | 61.8% | 26.2% |
| Mean | 33.4% | 11.7% |
| Median | 30.8% | 11.4% |
| Interquartile 25% (IQ1) | 18.0% | 9.3% |
| Interquartile 75% (IQ3) | 47.0% | 13.1% |
| Interquartile Range (IQR) | 29.0% | 3.8% |
| Standard Deviation (Sample) | 16.8% | 4.7% |
| Standard Deviation (Population) | 16.6% | 4.7% |
Similar Demographics by Receiving Food Stamps
Demographics Similar to Apache by Receiving Food Stamps
In terms of receiving food stamps, the demographic groups most similar to Apache are Colville (18.3%, a difference of 0.21%), Cuban (18.2%, a difference of 0.31%), Immigrants from Haiti (18.2%, a difference of 0.42%), Immigrants from Dominica (18.4%, a difference of 0.67%), and British West Indian (17.9%, a difference of 2.2%).
| Demographics | Rating | Rank | Receiving Food Stamps |
| Immigrants | Nicaragua | 0.0 /100 | #320 | Tragic 17.2% |
| Natives/Alaskans | 0.0 /100 | #321 | Tragic 17.3% |
| Immigrants | Grenada | 0.0 /100 | #322 | Tragic 17.8% |
| Haitians | 0.0 /100 | #323 | Tragic 17.8% |
| British West Indians | 0.0 /100 | #324 | Tragic 17.9% |
| Immigrants | Haiti | 0.0 /100 | #325 | Tragic 18.2% |
| Cubans | 0.0 /100 | #326 | Tragic 18.2% |
| Apache | 0.0 /100 | #327 | Tragic 18.3% |
| Colville | 0.0 /100 | #328 | Tragic 18.3% |
| Immigrants | Dominica | 0.0 /100 | #329 | Tragic 18.4% |
| Pima | 0.0 /100 | #330 | Tragic 19.0% |
| Immigrants | Caribbean | 0.0 /100 | #331 | Tragic 19.6% |
| Pueblo | 0.0 /100 | #332 | Tragic 19.9% |
| Inupiat | 0.0 /100 | #333 | Tragic 20.1% |
| Yuman | 0.0 /100 | #334 | Tragic 20.2% |
Demographics Similar to Immigrants from Vietnam by Receiving Food Stamps
In terms of receiving food stamps, the demographic groups most similar to Immigrants from Vietnam are Chilean (11.0%, a difference of 0.17%), Immigrants from Northern Africa (11.0%, a difference of 0.25%), Celtic (10.9%, a difference of 0.36%), Syrian (11.0%, a difference of 0.40%), and Hungarian (11.0%, a difference of 0.51%).
| Demographics | Rating | Rank | Receiving Food Stamps |
| Immigrants | Brazil | 90.3 /100 | #134 | Exceptional 10.8% |
| Argentineans | 90.2 /100 | #135 | Exceptional 10.8% |
| Slovaks | 89.8 /100 | #136 | Excellent 10.8% |
| Immigrants | Eastern Europe | 89.8 /100 | #137 | Excellent 10.8% |
| Immigrants | Moldova | 88.5 /100 | #138 | Excellent 10.9% |
| Hmong | 88.4 /100 | #139 | Excellent 10.9% |
| Celtics | 87.8 /100 | #140 | Excellent 10.9% |
| Immigrants | Vietnam | 86.7 /100 | #141 | Excellent 11.0% |
| Chileans | 86.2 /100 | #142 | Excellent 11.0% |
| Immigrants | Northern Africa | 86.0 /100 | #143 | Excellent 11.0% |
| Syrians | 85.5 /100 | #144 | Excellent 11.0% |
| Hungarians | 85.1 /100 | #145 | Excellent 11.0% |
| Taiwanese | 84.2 /100 | #146 | Excellent 11.0% |
| Whites/Caucasians | 83.9 /100 | #147 | Excellent 11.1% |
| Immigrants | South Eastern Asia | 83.3 /100 | #148 | Excellent 11.1% |