Apache vs Cree Receiving Food Stamps
COMPARE
Apache
Cree
Receiving Food Stamps
Receiving Food Stamps Comparison
Apache
Cree
18.3%
RECEIVING FOOD STAMPS
0.0/ 100
METRIC RATING
327th/ 347
METRIC RANK
13.7%
RECEIVING FOOD STAMPS
0.8/ 100
METRIC RATING
246th/ 347
METRIC RANK
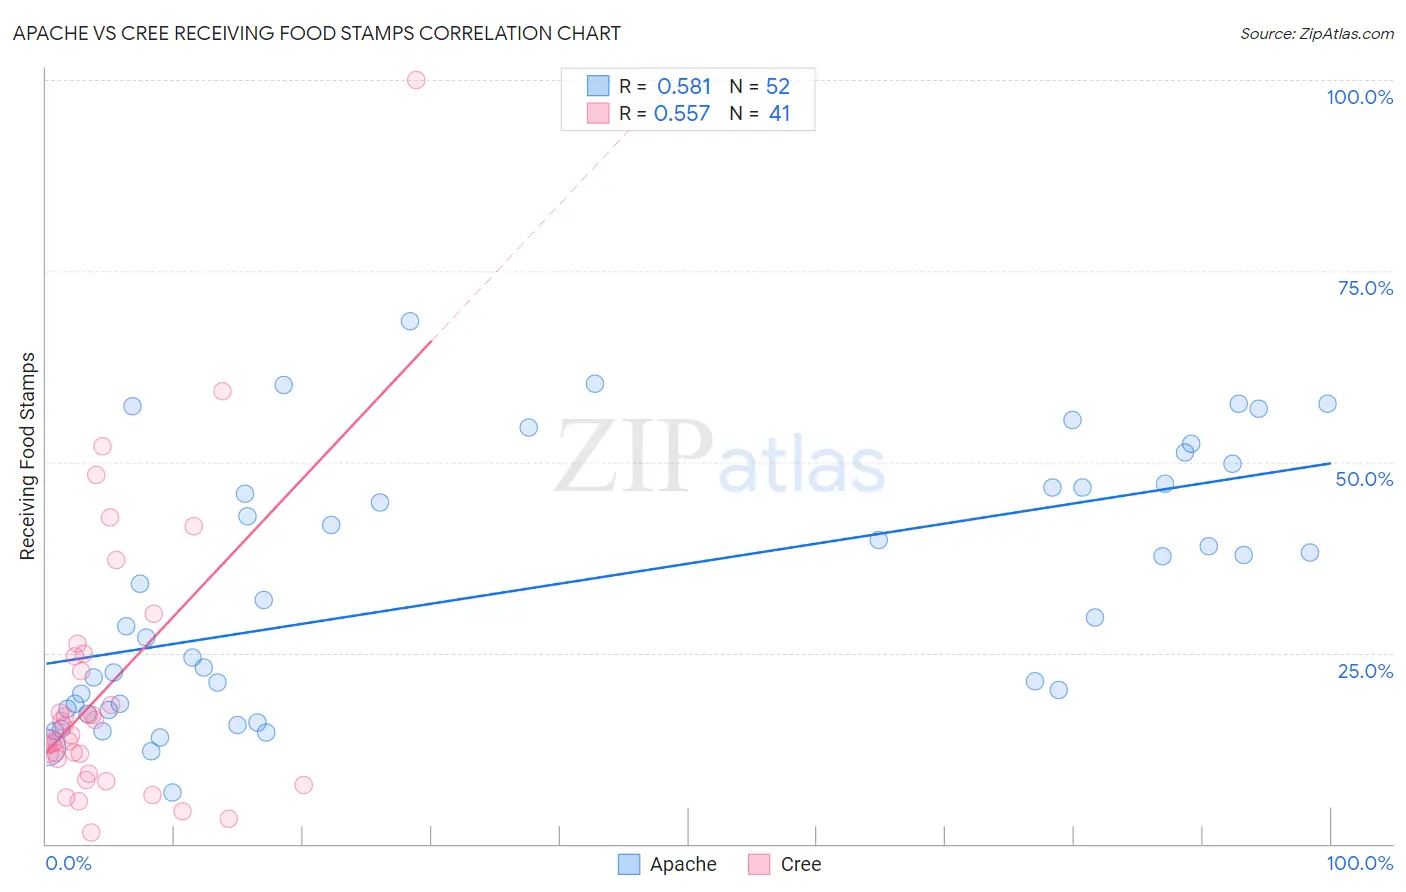
Apache vs Cree Receiving Food Stamps Correlation Chart
The statistical analysis conducted on geographies consisting of 230,963,565 people shows a substantial positive correlation between the proportion of Apache and percentage of population receiving government assistance and/or food stamps in the United States with a correlation coefficient (R) of 0.581 and weighted average of 18.3%. Similarly, the statistical analysis conducted on geographies consisting of 76,186,239 people shows a substantial positive correlation between the proportion of Cree and percentage of population receiving government assistance and/or food stamps in the United States with a correlation coefficient (R) of 0.557 and weighted average of 13.7%, a difference of 33.3%.
Receiving Food Stamps Correlation Summary
| Measurement | Apache | Cree |
| Minimum | 6.6% | 1.5% |
| Maximum | 68.4% | 100.0% |
| Range | 61.8% | 98.5% |
| Mean | 33.4% | 20.6% |
| Median | 30.8% | 14.2% |
| Interquartile 25% (IQ1) | 18.0% | 10.1% |
| Interquartile 75% (IQ3) | 47.0% | 24.7% |
| Interquartile Range (IQR) | 29.0% | 14.6% |
| Standard Deviation (Sample) | 16.8% | 18.6% |
| Standard Deviation (Population) | 16.6% | 18.4% |
Similar Demographics by Receiving Food Stamps
Demographics Similar to Apache by Receiving Food Stamps
In terms of receiving food stamps, the demographic groups most similar to Apache are Colville (18.3%, a difference of 0.21%), Cuban (18.2%, a difference of 0.31%), Immigrants from Haiti (18.2%, a difference of 0.42%), Immigrants from Dominica (18.4%, a difference of 0.67%), and British West Indian (17.9%, a difference of 2.2%).
| Demographics | Rating | Rank | Receiving Food Stamps |
| Immigrants | Nicaragua | 0.0 /100 | #320 | Tragic 17.2% |
| Natives/Alaskans | 0.0 /100 | #321 | Tragic 17.3% |
| Immigrants | Grenada | 0.0 /100 | #322 | Tragic 17.8% |
| Haitians | 0.0 /100 | #323 | Tragic 17.8% |
| British West Indians | 0.0 /100 | #324 | Tragic 17.9% |
| Immigrants | Haiti | 0.0 /100 | #325 | Tragic 18.2% |
| Cubans | 0.0 /100 | #326 | Tragic 18.2% |
| Apache | 0.0 /100 | #327 | Tragic 18.3% |
| Colville | 0.0 /100 | #328 | Tragic 18.3% |
| Immigrants | Dominica | 0.0 /100 | #329 | Tragic 18.4% |
| Pima | 0.0 /100 | #330 | Tragic 19.0% |
| Immigrants | Caribbean | 0.0 /100 | #331 | Tragic 19.6% |
| Pueblo | 0.0 /100 | #332 | Tragic 19.9% |
| Inupiat | 0.0 /100 | #333 | Tragic 20.1% |
| Yuman | 0.0 /100 | #334 | Tragic 20.2% |
Demographics Similar to Cree by Receiving Food Stamps
In terms of receiving food stamps, the demographic groups most similar to Cree are Immigrants from Somalia (13.7%, a difference of 0.24%), Mexican American Indian (13.8%, a difference of 0.27%), Cajun (13.7%, a difference of 0.28%), Immigrants from Laos (13.8%, a difference of 0.36%), and Somali (13.7%, a difference of 0.44%).
| Demographics | Rating | Rank | Receiving Food Stamps |
| Immigrants | Micronesia | 1.3 /100 | #239 | Tragic 13.5% |
| Iroquois | 1.2 /100 | #240 | Tragic 13.5% |
| Choctaw | 1.0 /100 | #241 | Tragic 13.6% |
| Immigrants | Panama | 1.0 /100 | #242 | Tragic 13.6% |
| Somalis | 0.9 /100 | #243 | Tragic 13.7% |
| Cajuns | 0.9 /100 | #244 | Tragic 13.7% |
| Immigrants | Somalia | 0.9 /100 | #245 | Tragic 13.7% |
| Cree | 0.8 /100 | #246 | Tragic 13.7% |
| Mexican American Indians | 0.7 /100 | #247 | Tragic 13.8% |
| Immigrants | Laos | 0.7 /100 | #248 | Tragic 13.8% |
| Indonesians | 0.6 /100 | #249 | Tragic 13.9% |
| Immigrants | Cambodia | 0.5 /100 | #250 | Tragic 13.9% |
| Yaqui | 0.5 /100 | #251 | Tragic 13.9% |
| Ghanaians | 0.5 /100 | #252 | Tragic 14.0% |
| Spanish Americans | 0.4 /100 | #253 | Tragic 14.0% |