Alsatian vs Soviet Union Receiving Food Stamps
COMPARE
Alsatian
Soviet Union
Receiving Food Stamps
Receiving Food Stamps Comparison
Alsatians
Soviet Union
11.4%
RECEIVING FOOD STAMPS
68.0/ 100
METRIC RATING
162nd/ 347
METRIC RANK
11.1%
RECEIVING FOOD STAMPS
83.1/ 100
METRIC RATING
150th/ 347
METRIC RANK
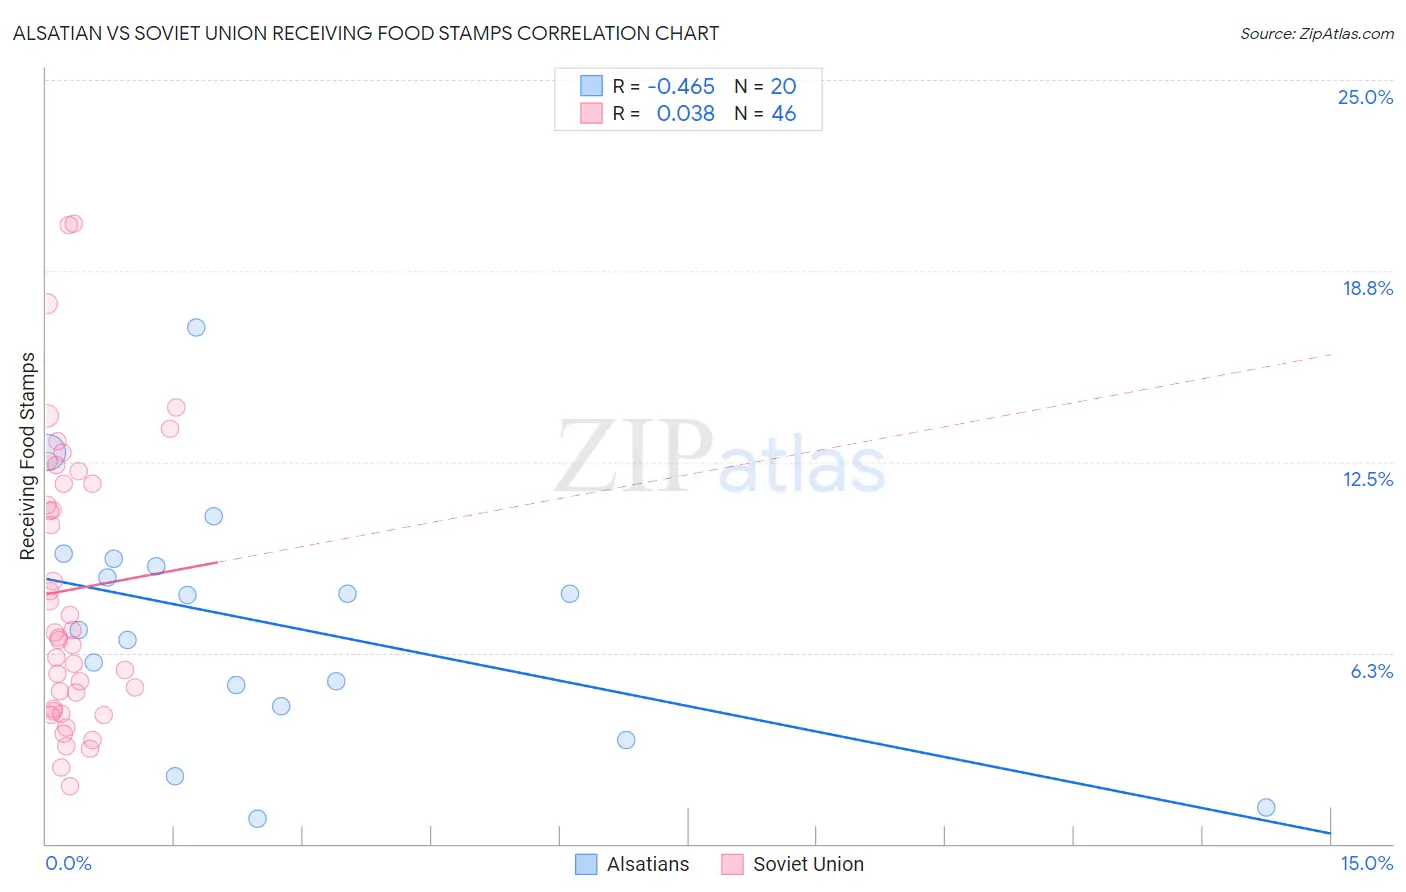
Alsatian vs Soviet Union Receiving Food Stamps Correlation Chart
The statistical analysis conducted on geographies consisting of 82,623,919 people shows a moderate negative correlation between the proportion of Alsatians and percentage of population receiving government assistance and/or food stamps in the United States with a correlation coefficient (R) of -0.465 and weighted average of 11.4%. Similarly, the statistical analysis conducted on geographies consisting of 43,471,584 people shows no correlation between the proportion of Soviet Union and percentage of population receiving government assistance and/or food stamps in the United States with a correlation coefficient (R) of 0.038 and weighted average of 11.1%, a difference of 3.1%.
Receiving Food Stamps Correlation Summary
| Measurement | Alsatian | Soviet Union |
| Minimum | 0.80% | 1.9% |
| Maximum | 16.9% | 20.3% |
| Range | 16.1% | 18.4% |
| Mean | 7.2% | 8.3% |
| Median | 7.6% | 6.8% |
| Interquartile 25% (IQ1) | 4.8% | 4.4% |
| Interquartile 75% (IQ3) | 9.2% | 11.8% |
| Interquartile Range (IQR) | 4.4% | 7.4% |
| Standard Deviation (Sample) | 3.9% | 4.6% |
| Standard Deviation (Population) | 3.8% | 4.6% |
Demographics Similar to Alsatians and Soviet Union by Receiving Food Stamps
In terms of receiving food stamps, the demographic groups most similar to Alsatians are Pennsylvania German (11.4%, a difference of 0.060%), French Canadian (11.4%, a difference of 0.25%), Immigrants from Southern Europe (11.5%, a difference of 0.37%), Immigrants from Oceania (11.4%, a difference of 0.41%), and Immigrants from Chile (11.5%, a difference of 0.48%). Similarly, the demographic groups most similar to Soviet Union are Brazilian (11.1%, a difference of 0.020%), Immigrants from South Eastern Asia (11.1%, a difference of 0.040%), White/Caucasian (11.1%, a difference of 0.21%), Taiwanese (11.0%, a difference of 0.30%), and Immigrants from Spain (11.1%, a difference of 0.36%).
| Demographics | Rating | Rank | Receiving Food Stamps |
| Taiwanese | 84.2 /100 | #146 | Excellent 11.0% |
| Whites/Caucasians | 83.9 /100 | #147 | Excellent 11.1% |
| Immigrants | South Eastern Asia | 83.3 /100 | #148 | Excellent 11.1% |
| Brazilians | 83.2 /100 | #149 | Excellent 11.1% |
| Soviet Union | 83.1 /100 | #150 | Excellent 11.1% |
| Immigrants | Spain | 81.7 /100 | #151 | Excellent 11.1% |
| Immigrants | Kazakhstan | 81.7 /100 | #152 | Excellent 11.1% |
| Lebanese | 81.6 /100 | #153 | Excellent 11.1% |
| Armenians | 81.4 /100 | #154 | Excellent 11.1% |
| Immigrants | Argentina | 80.4 /100 | #155 | Excellent 11.2% |
| Immigrants | Afghanistan | 75.6 /100 | #156 | Good 11.3% |
| Immigrants | Lebanon | 75.2 /100 | #157 | Good 11.3% |
| Immigrants | Bosnia and Herzegovina | 72.6 /100 | #158 | Good 11.3% |
| Immigrants | Oceania | 70.4 /100 | #159 | Good 11.4% |
| French Canadians | 69.5 /100 | #160 | Good 11.4% |
| Pennsylvania Germans | 68.4 /100 | #161 | Good 11.4% |
| Alsatians | 68.0 /100 | #162 | Good 11.4% |
| Immigrants | Southern Europe | 65.8 /100 | #163 | Good 11.5% |
| Immigrants | Chile | 65.0 /100 | #164 | Good 11.5% |
| Arabs | 64.7 /100 | #165 | Good 11.5% |
| Immigrants | Belarus | 62.8 /100 | #166 | Good 11.5% |