Apache vs Immigrants from Hungary Receiving Food Stamps
COMPARE
Apache
Immigrants from Hungary
Receiving Food Stamps
Receiving Food Stamps Comparison
Apache
Immigrants from Hungary
18.3%
RECEIVING FOOD STAMPS
0.0/ 100
METRIC RATING
327th/ 347
METRIC RANK
10.3%
RECEIVING FOOD STAMPS
96.7/ 100
METRIC RATING
104th/ 347
METRIC RANK
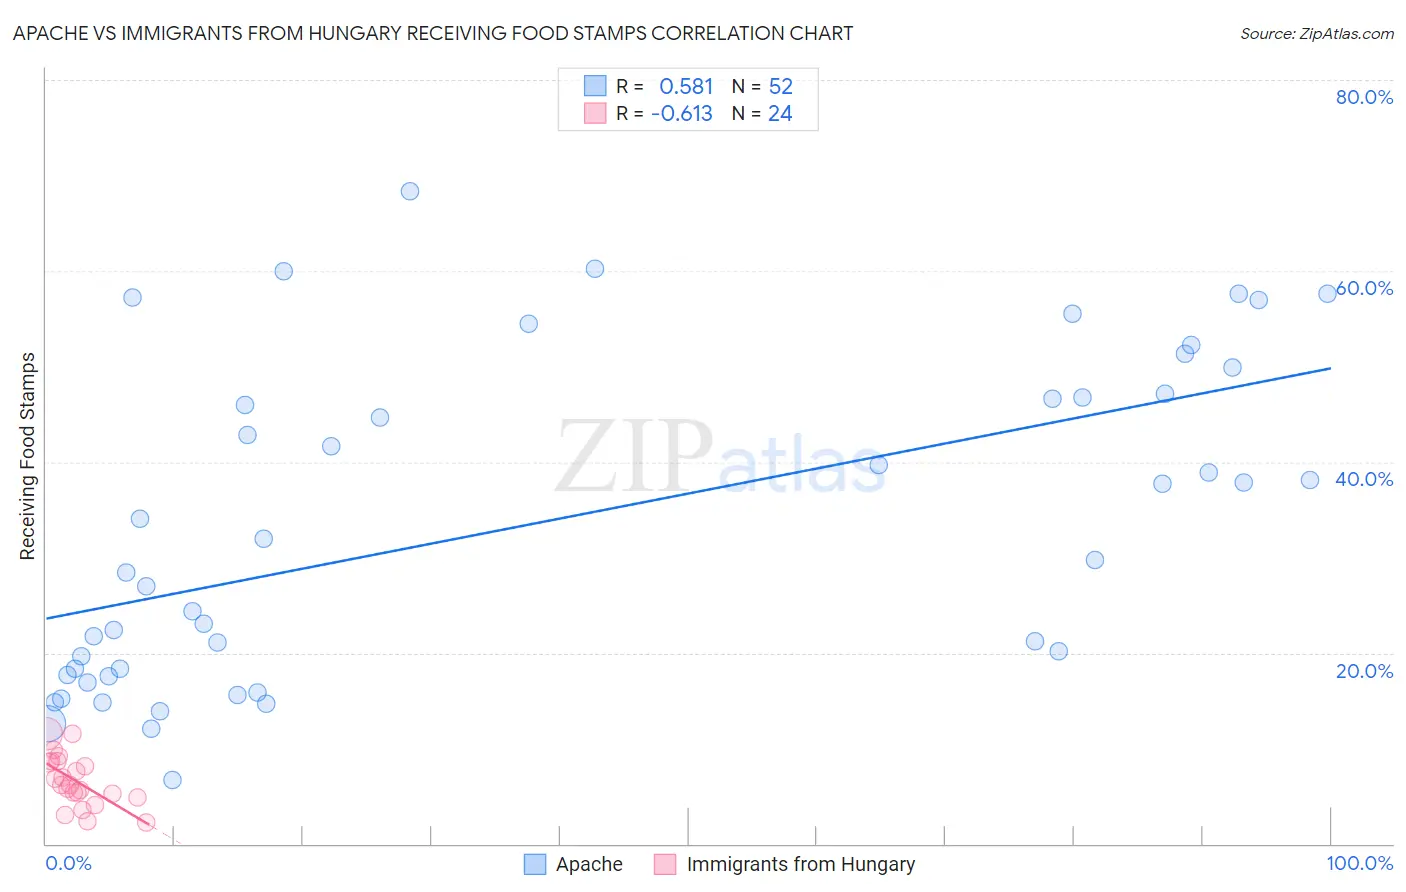
Apache vs Immigrants from Hungary Receiving Food Stamps Correlation Chart
The statistical analysis conducted on geographies consisting of 230,963,565 people shows a substantial positive correlation between the proportion of Apache and percentage of population receiving government assistance and/or food stamps in the United States with a correlation coefficient (R) of 0.581 and weighted average of 18.3%. Similarly, the statistical analysis conducted on geographies consisting of 195,389,493 people shows a significant negative correlation between the proportion of Immigrants from Hungary and percentage of population receiving government assistance and/or food stamps in the United States with a correlation coefficient (R) of -0.613 and weighted average of 10.3%, a difference of 76.7%.
Receiving Food Stamps Correlation Summary
| Measurement | Apache | Immigrants from Hungary |
| Minimum | 6.6% | 2.2% |
| Maximum | 68.4% | 11.6% |
| Range | 61.8% | 9.4% |
| Mean | 33.4% | 6.6% |
| Median | 30.8% | 6.2% |
| Interquartile 25% (IQ1) | 18.0% | 5.1% |
| Interquartile 75% (IQ3) | 47.0% | 8.6% |
| Interquartile Range (IQR) | 29.0% | 3.5% |
| Standard Deviation (Sample) | 16.8% | 2.6% |
| Standard Deviation (Population) | 16.6% | 2.6% |
Similar Demographics by Receiving Food Stamps
Demographics Similar to Apache by Receiving Food Stamps
In terms of receiving food stamps, the demographic groups most similar to Apache are Colville (18.3%, a difference of 0.21%), Cuban (18.2%, a difference of 0.31%), Immigrants from Haiti (18.2%, a difference of 0.42%), Immigrants from Dominica (18.4%, a difference of 0.67%), and British West Indian (17.9%, a difference of 2.2%).
| Demographics | Rating | Rank | Receiving Food Stamps |
| Immigrants | Nicaragua | 0.0 /100 | #320 | Tragic 17.2% |
| Natives/Alaskans | 0.0 /100 | #321 | Tragic 17.3% |
| Immigrants | Grenada | 0.0 /100 | #322 | Tragic 17.8% |
| Haitians | 0.0 /100 | #323 | Tragic 17.8% |
| British West Indians | 0.0 /100 | #324 | Tragic 17.9% |
| Immigrants | Haiti | 0.0 /100 | #325 | Tragic 18.2% |
| Cubans | 0.0 /100 | #326 | Tragic 18.2% |
| Apache | 0.0 /100 | #327 | Tragic 18.3% |
| Colville | 0.0 /100 | #328 | Tragic 18.3% |
| Immigrants | Dominica | 0.0 /100 | #329 | Tragic 18.4% |
| Pima | 0.0 /100 | #330 | Tragic 19.0% |
| Immigrants | Caribbean | 0.0 /100 | #331 | Tragic 19.6% |
| Pueblo | 0.0 /100 | #332 | Tragic 19.9% |
| Inupiat | 0.0 /100 | #333 | Tragic 20.1% |
| Yuman | 0.0 /100 | #334 | Tragic 20.2% |
Demographics Similar to Immigrants from Hungary by Receiving Food Stamps
In terms of receiving food stamps, the demographic groups most similar to Immigrants from Hungary are Immigrants from Latvia (10.3%, a difference of 0.010%), Immigrants from Europe (10.3%, a difference of 0.11%), Palestinian (10.3%, a difference of 0.19%), Immigrants from Western Europe (10.3%, a difference of 0.20%), and Serbian (10.3%, a difference of 0.32%).
| Demographics | Rating | Rank | Receiving Food Stamps |
| Czechoslovakians | 97.2 /100 | #97 | Exceptional 10.3% |
| Immigrants | Egypt | 97.1 /100 | #98 | Exceptional 10.3% |
| Serbians | 97.0 /100 | #99 | Exceptional 10.3% |
| Immigrants | Western Europe | 96.9 /100 | #100 | Exceptional 10.3% |
| Palestinians | 96.9 /100 | #101 | Exceptional 10.3% |
| Immigrants | Europe | 96.8 /100 | #102 | Exceptional 10.3% |
| Immigrants | Latvia | 96.8 /100 | #103 | Exceptional 10.3% |
| Immigrants | Hungary | 96.7 /100 | #104 | Exceptional 10.3% |
| Immigrants | Malaysia | 96.5 /100 | #105 | Exceptional 10.4% |
| Immigrants | Italy | 96.4 /100 | #106 | Exceptional 10.4% |
| Koreans | 96.3 /100 | #107 | Exceptional 10.4% |
| Carpatho Rusyns | 96.2 /100 | #108 | Exceptional 10.4% |
| Immigrants | Pakistan | 96.2 /100 | #109 | Exceptional 10.4% |
| Pakistanis | 95.9 /100 | #110 | Exceptional 10.4% |
| Romanians | 95.8 /100 | #111 | Exceptional 10.4% |