Soviet Union vs Inupiat Married-Couple Family Poverty
COMPARE
Soviet Union
Inupiat
Married-Couple Family Poverty
Married-Couple Family Poverty Comparison
Soviet Union
Inupiat
4.9%
MARRIED-COUPLE FAMILY POVERTY
90.7/ 100
METRIC RATING
130th/ 347
METRIC RANK
7.1%
MARRIED-COUPLE FAMILY POVERTY
0.0/ 100
METRIC RATING
315th/ 347
METRIC RANK
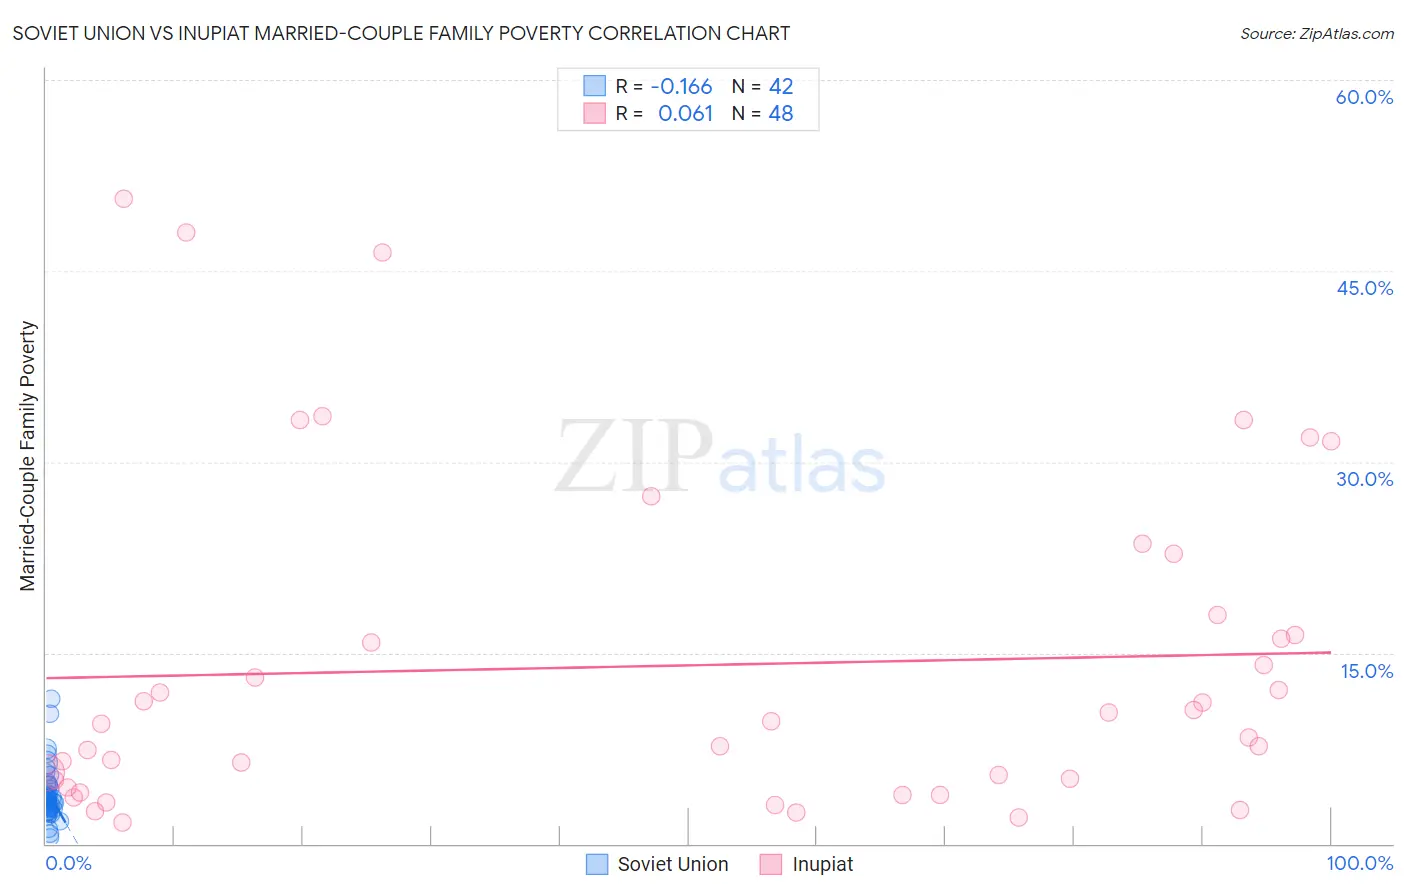
Soviet Union vs Inupiat Married-Couple Family Poverty Correlation Chart
The statistical analysis conducted on geographies consisting of 43,419,717 people shows a poor negative correlation between the proportion of Soviet Union and poverty level among married-couple families in the United States with a correlation coefficient (R) of -0.166 and weighted average of 4.9%. Similarly, the statistical analysis conducted on geographies consisting of 96,004,773 people shows a slight positive correlation between the proportion of Inupiat and poverty level among married-couple families in the United States with a correlation coefficient (R) of 0.061 and weighted average of 7.1%, a difference of 46.6%.
Married-Couple Family Poverty Correlation Summary
| Measurement | Soviet Union | Inupiat |
| Minimum | 0.48% | 1.6% |
| Maximum | 11.4% | 50.7% |
| Range | 10.9% | 49.0% |
| Mean | 3.9% | 14.0% |
| Median | 3.4% | 9.6% |
| Interquartile 25% (IQ1) | 2.7% | 4.7% |
| Interquartile 75% (IQ3) | 4.6% | 17.2% |
| Interquartile Range (IQR) | 1.9% | 12.5% |
| Standard Deviation (Sample) | 2.2% | 12.9% |
| Standard Deviation (Population) | 2.1% | 12.8% |
Similar Demographics by Married-Couple Family Poverty
Demographics Similar to Soviet Union by Married-Couple Family Poverty
In terms of married-couple family poverty, the demographic groups most similar to Soviet Union are Immigrants from Pakistan (4.9%, a difference of 0.010%), Immigrants from Eastern Europe (4.9%, a difference of 0.070%), Puget Sound Salish (4.9%, a difference of 0.080%), Immigrants from Kenya (4.9%, a difference of 0.15%), and Samoan (4.9%, a difference of 0.16%).
| Demographics | Rating | Rank | Married-Couple Family Poverty |
| Jordanians | 93.1 /100 | #123 | Exceptional 4.8% |
| Romanians | 92.5 /100 | #124 | Exceptional 4.8% |
| Immigrants | Bosnia and Herzegovina | 92.5 /100 | #125 | Exceptional 4.8% |
| Immigrants | Asia | 92.3 /100 | #126 | Exceptional 4.8% |
| Egyptians | 92.0 /100 | #127 | Exceptional 4.8% |
| Palestinians | 91.2 /100 | #128 | Exceptional 4.9% |
| Immigrants | Pakistan | 90.7 /100 | #129 | Exceptional 4.9% |
| Soviet Union | 90.7 /100 | #130 | Exceptional 4.9% |
| Immigrants | Eastern Europe | 90.5 /100 | #131 | Exceptional 4.9% |
| Puget Sound Salish | 90.4 /100 | #132 | Exceptional 4.9% |
| Immigrants | Kenya | 90.2 /100 | #133 | Exceptional 4.9% |
| Samoans | 90.2 /100 | #134 | Exceptional 4.9% |
| Assyrians/Chaldeans/Syriacs | 89.4 /100 | #135 | Excellent 4.9% |
| Immigrants | Hungary | 88.7 /100 | #136 | Excellent 4.9% |
| Guamanians/Chamorros | 86.5 /100 | #137 | Excellent 4.9% |
Demographics Similar to Inupiat by Married-Couple Family Poverty
In terms of married-couple family poverty, the demographic groups most similar to Inupiat are Honduran (7.2%, a difference of 0.15%), British West Indian (7.1%, a difference of 0.24%), Mexican (7.2%, a difference of 0.47%), Immigrants from St. Vincent and the Grenadines (7.1%, a difference of 0.54%), and Immigrants from Guatemala (7.2%, a difference of 0.63%).
| Demographics | Rating | Rank | Married-Couple Family Poverty |
| Spanish American Indians | 0.0 /100 | #308 | Tragic 7.1% |
| Hopi | 0.0 /100 | #309 | Tragic 7.1% |
| Immigrants | Nicaragua | 0.0 /100 | #310 | Tragic 7.1% |
| Immigrants | Dominica | 0.0 /100 | #311 | Tragic 7.1% |
| Immigrants | Armenia | 0.0 /100 | #312 | Tragic 7.1% |
| Immigrants | St. Vincent and the Grenadines | 0.0 /100 | #313 | Tragic 7.1% |
| British West Indians | 0.0 /100 | #314 | Tragic 7.1% |
| Inupiat | 0.0 /100 | #315 | Tragic 7.1% |
| Hondurans | 0.0 /100 | #316 | Tragic 7.2% |
| Mexicans | 0.0 /100 | #317 | Tragic 7.2% |
| Immigrants | Guatemala | 0.0 /100 | #318 | Tragic 7.2% |
| Immigrants | Latin America | 0.0 /100 | #319 | Tragic 7.2% |
| Immigrants | Grenada | 0.0 /100 | #320 | Tragic 7.3% |
| Immigrants | Caribbean | 0.0 /100 | #321 | Tragic 7.3% |
| Immigrants | Honduras | 0.0 /100 | #322 | Tragic 7.3% |