Nye County, NV Map & Demographics
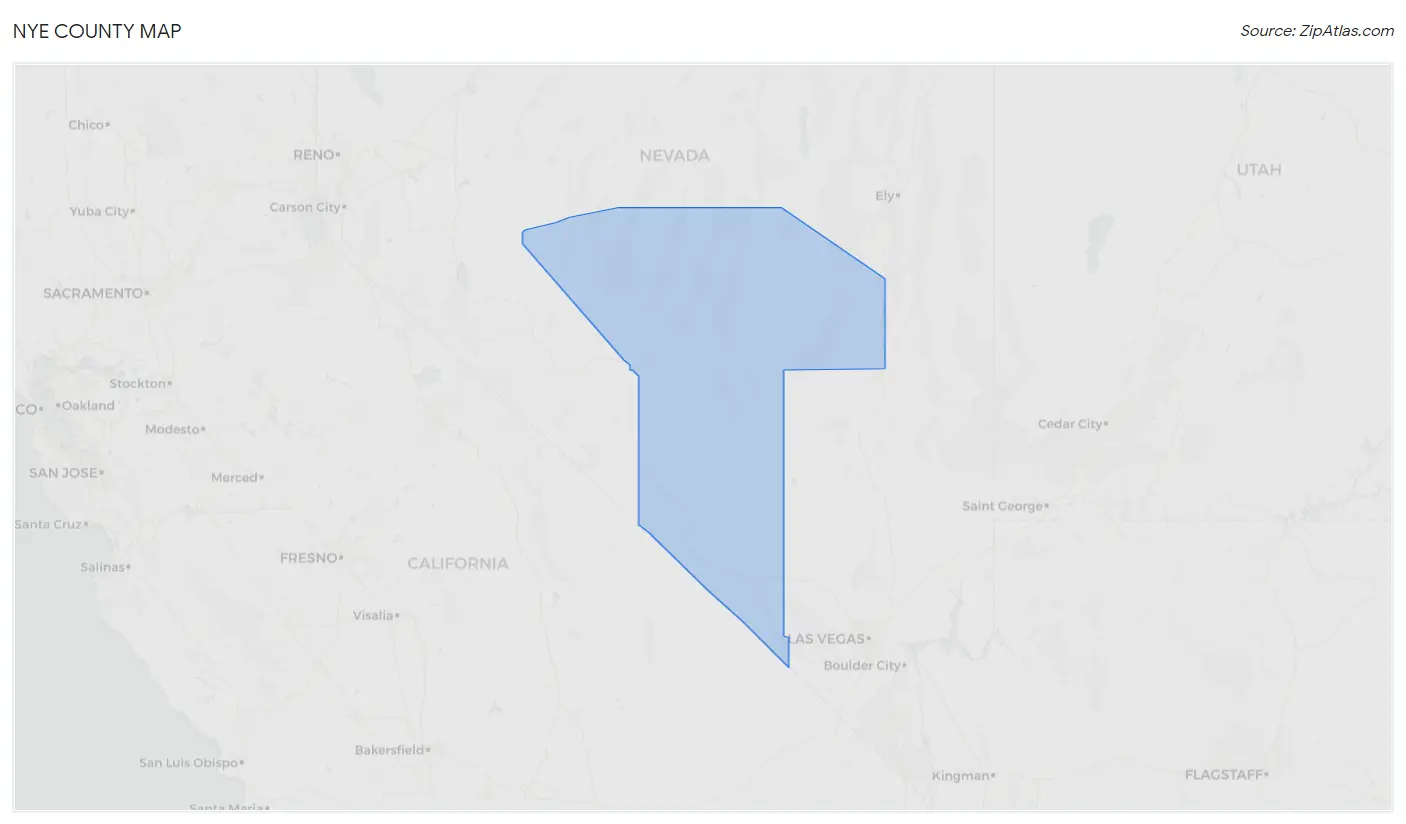
Nye County Map
Nye County Overview
$30,751
PER CAPITA INCOME
$64,001
AVG FAMILY INCOME
$53,602
AVG HOUSEHOLD INCOME
25.6%
WAGE / INCOME GAP [ % ]
74.4¢/ $1
WAGE / INCOME GAP [ $ ]
$9,504
FAMILY INCOME DEFICIT
0.44
INEQUALITY / GINI INDEX
51,698
TOTAL POPULATION
26,290
MALE POPULATION
25,408
FEMALE POPULATION
103.47
MALES / 100 FEMALES
96.65
FEMALES / 100 MALES
52.9
MEDIAN AGE
2.8
AVG FAMILY SIZE
2.3
AVG HOUSEHOLD SIZE
18,512
LABOR FORCE [ PEOPLE ]
41.8%
PERCENT IN LABOR FORCE
9.3%
UNEMPLOYMENT RATE
Income in Nye County
Income Overview in Nye County
Per Capita Income in Nye County is $30,751, while median incomes of families and households are $64,001 and $53,602 respectively.
| Characteristic | Number | Measure |
| Per Capita Income | 51,698 | $30,751 |
| Median Family Income | 13,325 | $64,001 |
| Mean Family Income | 13,325 | $81,770 |
| Median Household Income | 21,847 | $53,602 |
| Mean Household Income | 21,847 | $71,428 |
| Income Deficit | 13,325 | $9,504 |
| Wage / Income Gap (%) | 51,698 | 25.60% |
| Wage / Income Gap ($) | 51,698 | 74.40¢ per $1 |
| Gini / Inequality Index | 51,698 | 0.44 |
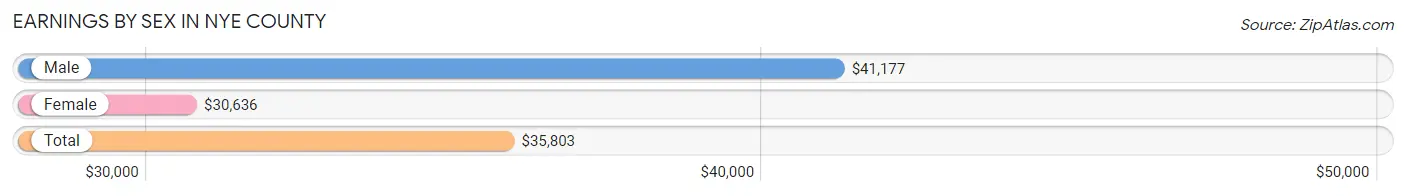
Earnings by Sex in Nye County
Average Earnings in Nye County are $35,803, $41,177 for men and $30,636 for women, a difference of 25.6%.
| Sex | Number | Average Earnings |
| Male | 11,041 (58.0%) | $41,177 |
| Female | 7,983 (42.0%) | $30,636 |
| Total | 19,024 (100.0%) | $35,803 |
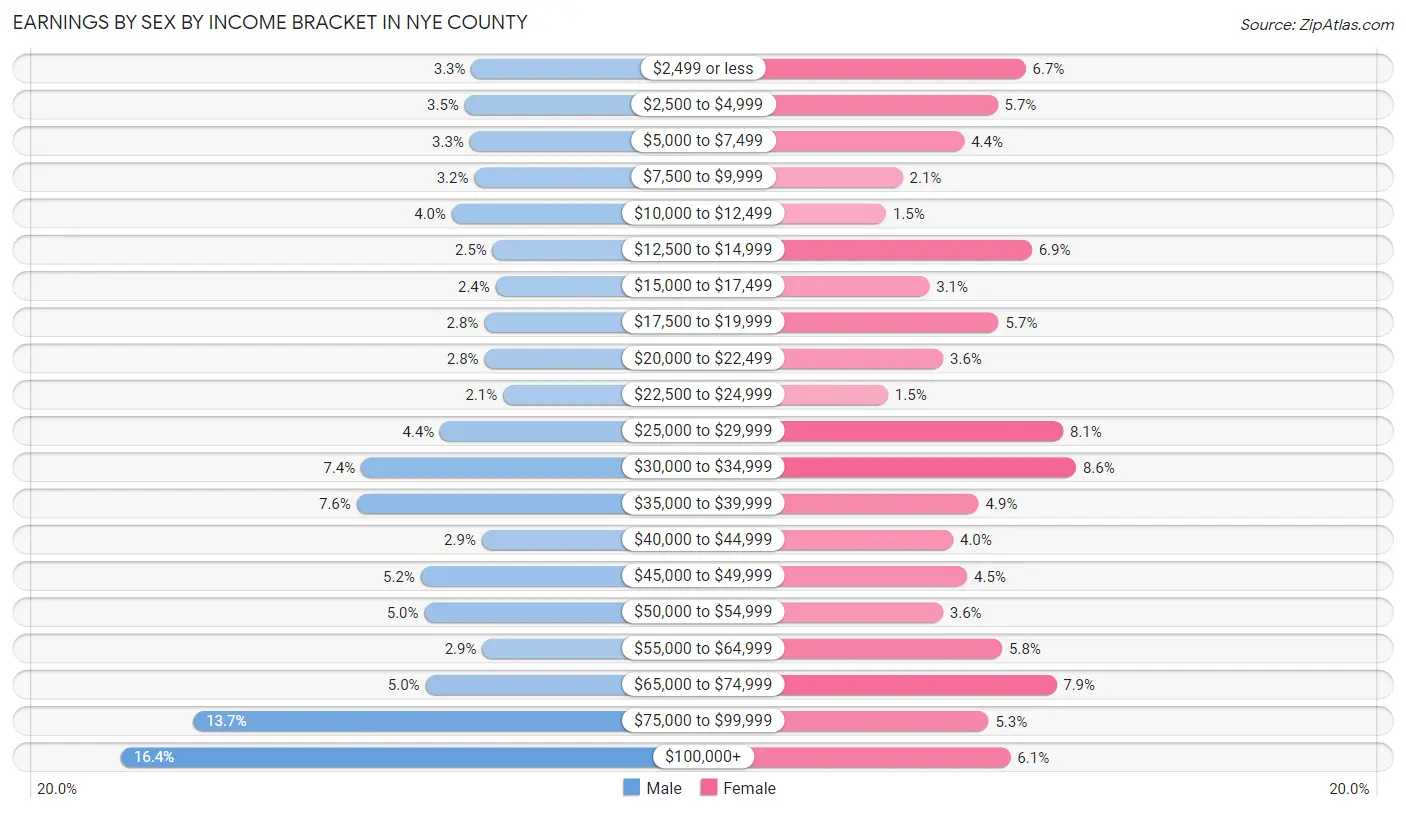
Earnings by Sex by Income Bracket in Nye County
The most common earnings brackets in Nye County are $100,000+ for men (1,810 | 16.4%) and $30,000 to $34,999 for women (686 | 8.6%).
| Income | Male | Female |
| $2,499 or less | 360 (3.3%) | 535 (6.7%) |
| $2,500 to $4,999 | 388 (3.5%) | 451 (5.7%) |
| $5,000 to $7,499 | 367 (3.3%) | 351 (4.4%) |
| $7,500 to $9,999 | 348 (3.2%) | 167 (2.1%) |
| $10,000 to $12,499 | 440 (4.0%) | 117 (1.5%) |
| $12,500 to $14,999 | 272 (2.5%) | 553 (6.9%) |
| $15,000 to $17,499 | 259 (2.4%) | 247 (3.1%) |
| $17,500 to $19,999 | 307 (2.8%) | 454 (5.7%) |
| $20,000 to $22,499 | 306 (2.8%) | 288 (3.6%) |
| $22,500 to $24,999 | 228 (2.1%) | 123 (1.5%) |
| $25,000 to $29,999 | 489 (4.4%) | 647 (8.1%) |
| $30,000 to $34,999 | 816 (7.4%) | 686 (8.6%) |
| $35,000 to $39,999 | 835 (7.6%) | 394 (4.9%) |
| $40,000 to $44,999 | 317 (2.9%) | 318 (4.0%) |
| $45,000 to $49,999 | 570 (5.2%) | 360 (4.5%) |
| $50,000 to $54,999 | 554 (5.0%) | 287 (3.6%) |
| $55,000 to $64,999 | 315 (2.9%) | 465 (5.8%) |
| $65,000 to $74,999 | 550 (5.0%) | 627 (7.9%) |
| $75,000 to $99,999 | 1,510 (13.7%) | 424 (5.3%) |
| $100,000+ | 1,810 (16.4%) | 489 (6.1%) |
| Total | 11,041 (100.0%) | 7,983 (100.0%) |
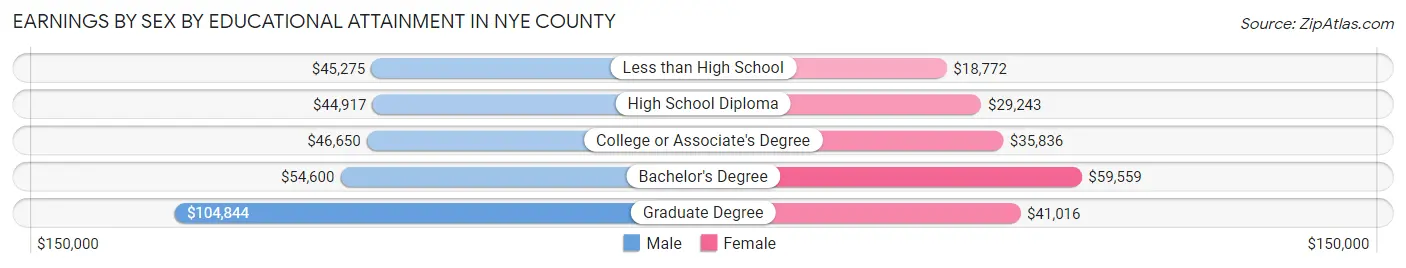
Earnings by Sex by Educational Attainment in Nye County
Average earnings in Nye County are $46,754 for men and $32,937 for women, a difference of 29.5%. Men with an educational attainment of graduate degree enjoy the highest average annual earnings of $104,844, while those with high school diploma education earn the least with $44,917. Women with an educational attainment of bachelor's degree earn the most with the average annual earnings of $59,559, while those with less than high school education have the smallest earnings of $18,772.
| Educational Attainment | Male Income | Female Income |
| Less than High School | $45,275 | $18,772 |
| High School Diploma | $44,917 | $29,243 |
| College or Associate's Degree | $46,650 | $35,836 |
| Bachelor's Degree | $54,600 | $59,559 |
| Graduate Degree | $104,844 | $41,016 |
| Total | $46,754 | $32,937 |
Family Income in Nye County
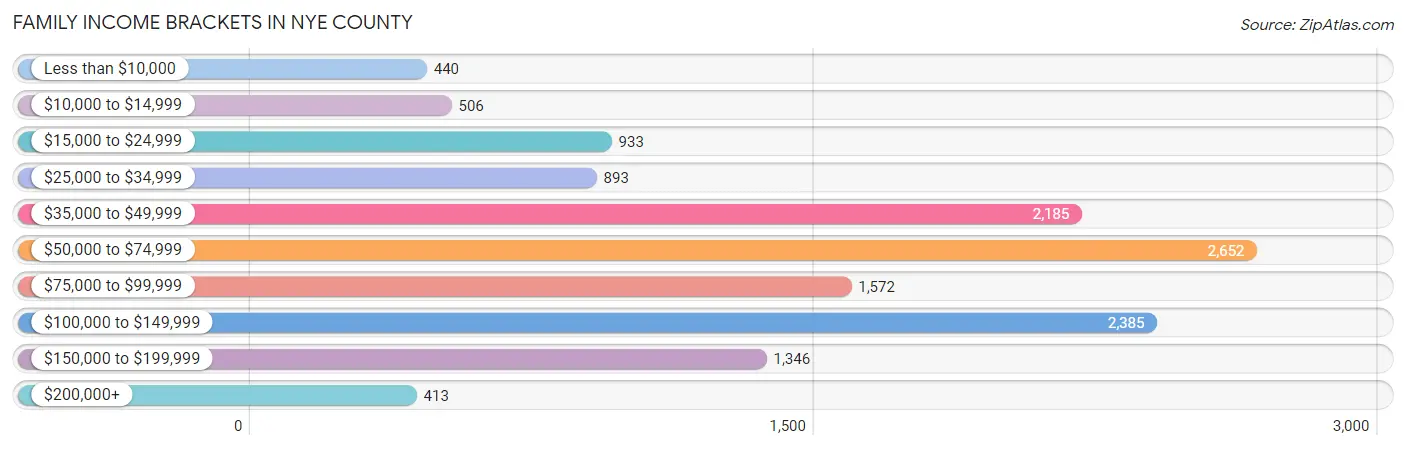
Family Income Brackets in Nye County
According to the Nye County family income data, there are 2,652 families falling into the $50,000 to $74,999 income range, which is the most common income bracket and makes up 19.9% of all families. Conversely, the $200,000+ income bracket is the least frequent group with only 413 families (3.1%) belonging to this category.
| Income Bracket | # Families | % Families |
| Less than $10,000 | 440 | 3.3% |
| $10,000 to $14,999 | 506 | 3.8% |
| $15,000 to $24,999 | 933 | 7.0% |
| $25,000 to $34,999 | 893 | 6.7% |
| $35,000 to $49,999 | 2,185 | 16.4% |
| $50,000 to $74,999 | 2,652 | 19.9% |
| $75,000 to $99,999 | 1,572 | 11.8% |
| $100,000 to $149,999 | 2,385 | 17.9% |
| $150,000 to $199,999 | 1,346 | 10.1% |
| $200,000+ | 413 | 3.1% |
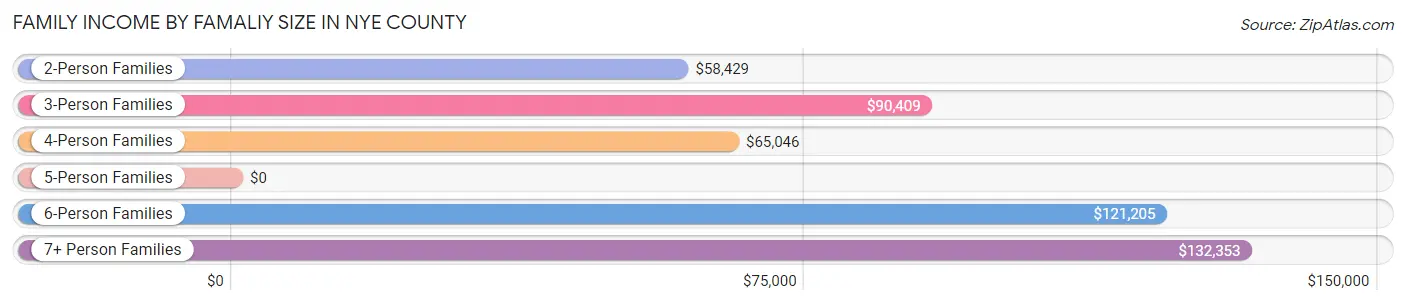
Family Income by Famaliy Size in Nye County
7+ person families (190 | 1.4%) account for the highest median family income in Nye County with $132,353 per family, while 3-person families (2,910 | 21.8%) have the highest median income of $30,136 per family member.
| Income Bracket | # Families | Median Income |
| 2-Person Families | 8,330 (62.5%) | $58,429 |
| 3-Person Families | 2,910 (21.8%) | $90,409 |
| 4-Person Families | 907 (6.8%) | $65,046 |
| 5-Person Families | 710 (5.3%) | $0 |
| 6-Person Families | 278 (2.1%) | $121,205 |
| 7+ Person Families | 190 (1.4%) | $132,353 |
| Total | 13,325 (100.0%) | $64,001 |
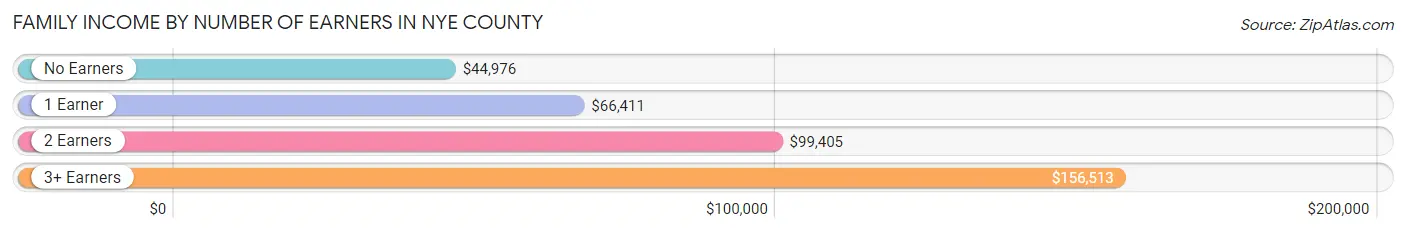
Family Income by Number of Earners in Nye County
The median family income in Nye County is $64,001, with families comprising 3+ earners (610) having the highest median family income of $156,513, while families with no earners (5,248) have the lowest median family income of $44,976, accounting for 4.6% and 39.4% of families, respectively.
| Number of Earners | # Families | Median Income |
| No Earners | 5,248 (39.4%) | $44,976 |
| 1 Earner | 4,495 (33.7%) | $66,411 |
| 2 Earners | 2,972 (22.3%) | $99,405 |
| 3+ Earners | 610 (4.6%) | $156,513 |
| Total | 13,325 (100.0%) | $64,001 |
Household Income in Nye County
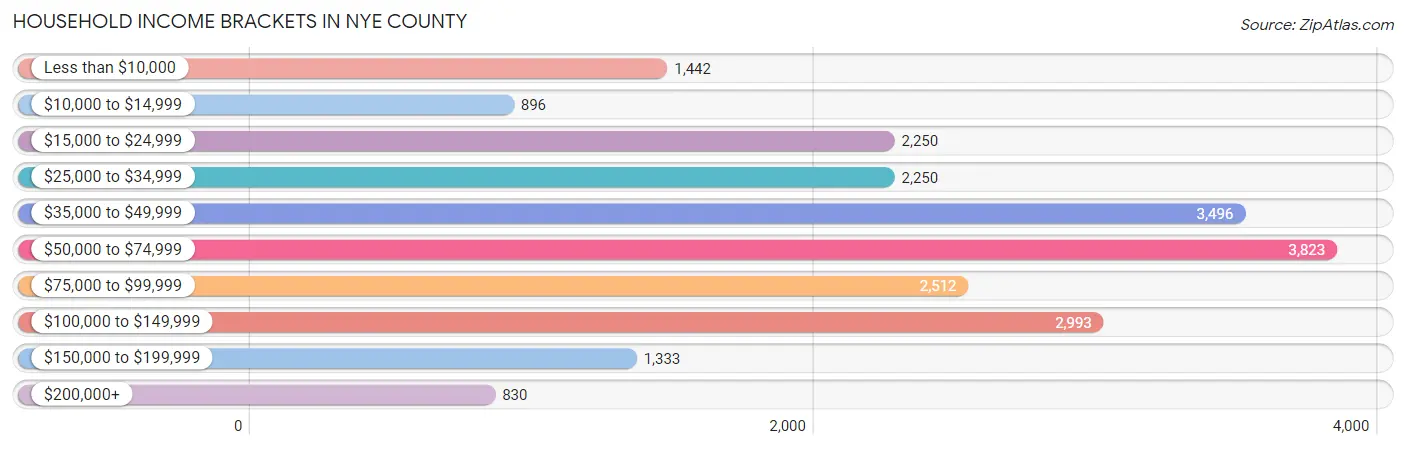
Household Income Brackets in Nye County
With 3,823 households falling in the category, the $50,000 to $74,999 income range is the most frequent in Nye County, accounting for 17.5% of all households. In contrast, only 830 households (3.8%) fall into the $200,000+ income bracket, making it the least populous group.
| Income Bracket | # Households | % Households |
| Less than $10,000 | 1,442 | 6.6% |
| $10,000 to $14,999 | 896 | 4.1% |
| $15,000 to $24,999 | 2,250 | 10.3% |
| $25,000 to $34,999 | 2,250 | 10.3% |
| $35,000 to $49,999 | 3,496 | 16.0% |
| $50,000 to $74,999 | 3,823 | 17.5% |
| $75,000 to $99,999 | 2,512 | 11.5% |
| $100,000 to $149,999 | 2,993 | 13.7% |
| $150,000 to $199,999 | 1,333 | 6.1% |
| $200,000+ | 830 | 3.8% |
Household Income by Householder Age in Nye County
The median household income in Nye County is $53,602, with the highest median household income of $69,678 found in the 25 to 44 years age bracket for the primary householder. A total of 3,876 households (17.7%) fall into this category. Meanwhile, the 15 to 24 years age bracket for the primary householder has the lowest median household income of $41,250, with 650 households (3.0%) in this group.
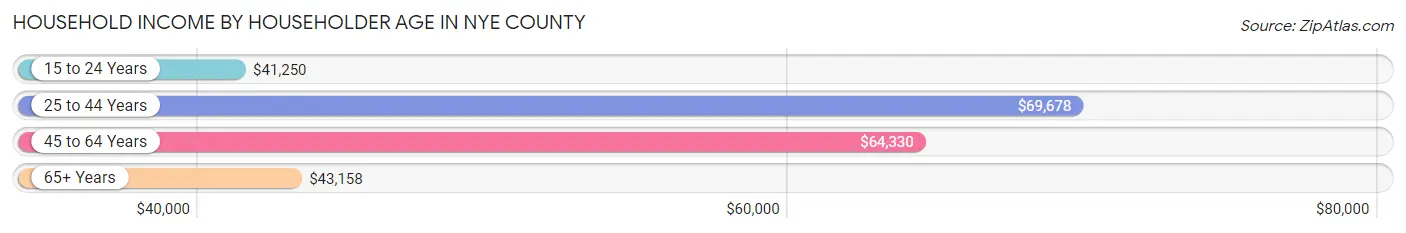
| Income Bracket | # Households | Median Income |
| 15 to 24 Years | 650 (3.0%) | $41,250 |
| 25 to 44 Years | 3,876 (17.7%) | $69,678 |
| 45 to 64 Years | 8,243 (37.7%) | $64,330 |
| 65+ Years | 9,078 (41.5%) | $43,158 |
| Total | 21,847 (100.0%) | $53,602 |
Poverty in Nye County
Income Below Poverty by Sex and Age in Nye County
With 14.6% poverty level for males and 16.0% for females among the residents of Nye County, 15 year old males and 12 to 14 year old females are the most vulnerable to poverty, with 92 males (27.1%) and 193 females (31.0%) in their respective age groups living below the poverty level.
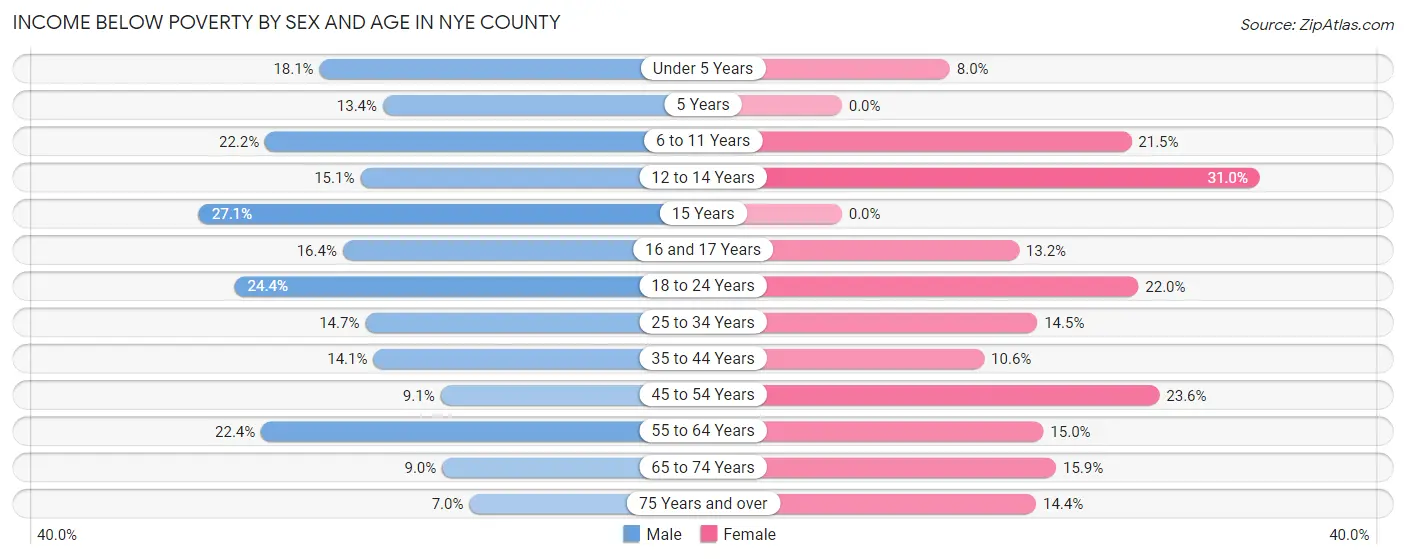
| Age Bracket | Male | Female |
| Under 5 Years | 136 (18.1%) | 99 (8.0%) |
| 5 Years | 26 (13.4%) | 0 (0.0%) |
| 6 to 11 Years | 329 (22.2%) | 264 (21.5%) |
| 12 to 14 Years | 108 (15.1%) | 193 (31.0%) |
| 15 Years | 92 (27.1%) | 0 (0.0%) |
| 16 and 17 Years | 85 (16.4%) | 89 (13.2%) |
| 18 to 24 Years | 347 (24.4%) | 270 (22.0%) |
| 25 to 34 Years | 398 (14.7%) | 334 (14.5%) |
| 35 to 44 Years | 340 (14.1%) | 237 (10.6%) |
| 45 to 54 Years | 262 (9.1%) | 662 (23.6%) |
| 55 to 64 Years | 973 (22.4%) | 661 (15.0%) |
| 65 to 74 Years | 423 (9.0%) | 772 (15.9%) |
| 75 Years and over | 226 (7.0%) | 420 (14.4%) |
| Total | 3,745 (14.6%) | 4,001 (16.0%) |
Income Above Poverty by Sex and Age in Nye County
According to the poverty statistics in Nye County, males aged 75 years and over and females aged 5 years are the age groups that are most secure financially, with 93.0% of males and 100.0% of females in these age groups living above the poverty line.
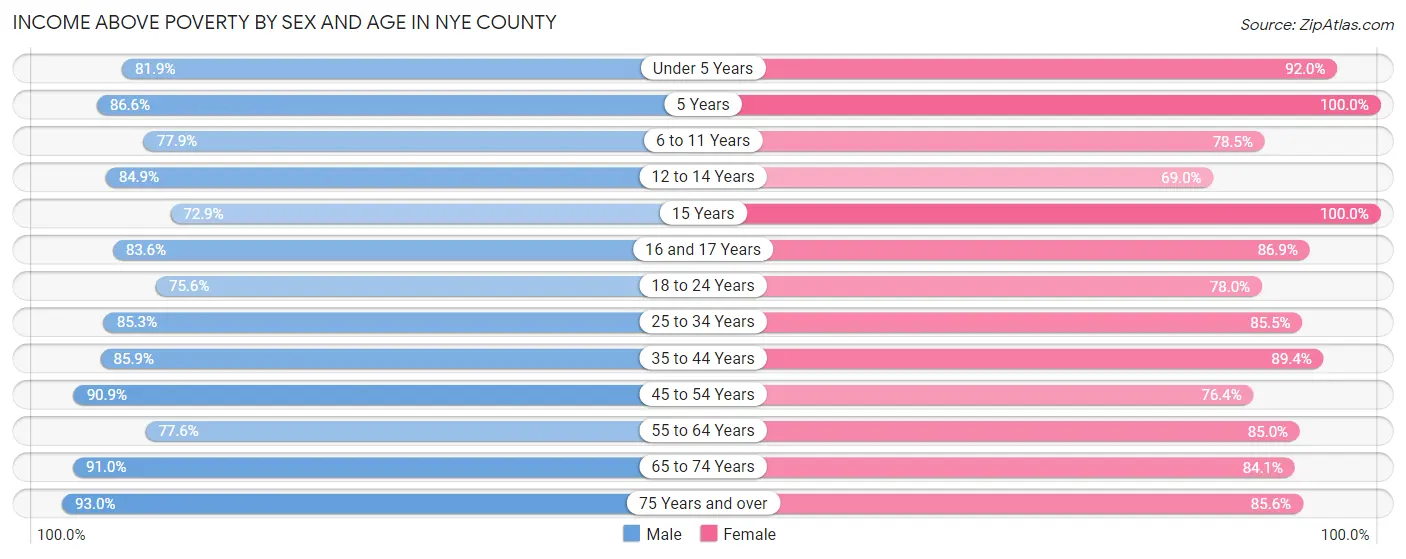
| Age Bracket | Male | Female |
| Under 5 Years | 615 (81.9%) | 1,135 (92.0%) |
| 5 Years | 168 (86.6%) | 318 (100.0%) |
| 6 to 11 Years | 1,156 (77.8%) | 964 (78.5%) |
| 12 to 14 Years | 608 (84.9%) | 429 (69.0%) |
| 15 Years | 248 (72.9%) | 120 (100.0%) |
| 16 and 17 Years | 434 (83.6%) | 588 (86.9%) |
| 18 to 24 Years | 1,075 (75.6%) | 956 (78.0%) |
| 25 to 34 Years | 2,307 (85.3%) | 1,968 (85.5%) |
| 35 to 44 Years | 2,069 (85.9%) | 2,006 (89.4%) |
| 45 to 54 Years | 2,611 (90.9%) | 2,145 (76.4%) |
| 55 to 64 Years | 3,363 (77.6%) | 3,755 (85.0%) |
| 65 to 74 Years | 4,279 (91.0%) | 4,080 (84.1%) |
| 75 Years and over | 3,013 (93.0%) | 2,492 (85.6%) |
| Total | 21,946 (85.4%) | 20,956 (84.0%) |
Income Below Poverty Among Married-Couple Families in Nye County
The poverty statistics for married-couple families in Nye County show that 8.5% or 872 of the total 10,275 families live below the poverty line. Families with 5 or more children have the highest poverty rate of 21.6%, comprising of 11 families. On the other hand, families with 1 or 2 children have the lowest poverty rate of 7.9%, which includes 142 families.
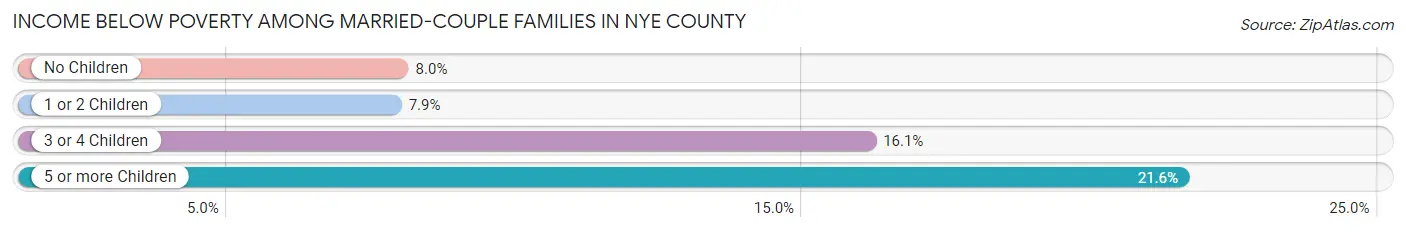
| Children | Above Poverty | Below Poverty |
| No Children | 7,196 (92.0%) | 623 (8.0%) |
| 1 or 2 Children | 1,667 (92.1%) | 142 (7.9%) |
| 3 or 4 Children | 500 (83.9%) | 96 (16.1%) |
| 5 or more Children | 40 (78.4%) | 11 (21.6%) |
| Total | 9,403 (91.5%) | 872 (8.5%) |
Income Below Poverty Among Single-Parent Households in Nye County
According to the poverty data in Nye County, 8.2% or 107 single-father households and 21.6% or 376 single-mother households are living below the poverty line. Among single-father households, those with 5 or more children have the highest poverty rate, with 16 households (100.0%) experiencing poverty. Likewise, among single-mother households, those with 1 or 2 children have the highest poverty rate, with 312 households (33.5%) falling below the poverty line.
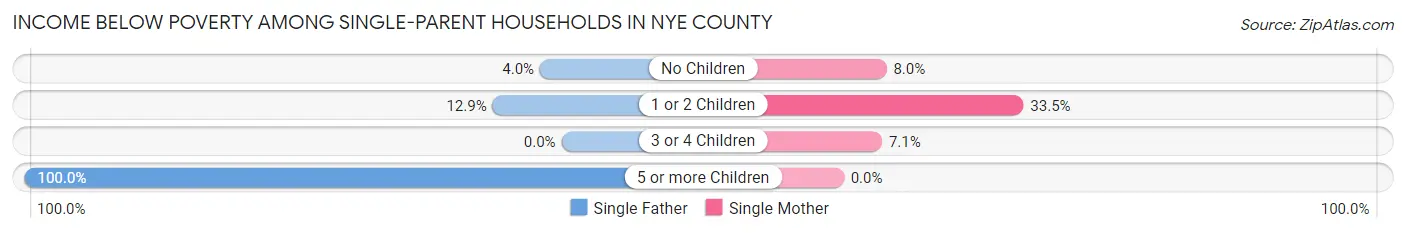
| Children | Single Father | Single Mother |
| No Children | 31 (4.0%) | 60 (8.0%) |
| 1 or 2 Children | 60 (12.9%) | 312 (33.5%) |
| 3 or 4 Children | 0 (0.0%) | 4 (7.1%) |
| 5 or more Children | 16 (100.0%) | 0 (0.0%) |
| Total | 107 (8.2%) | 376 (21.6%) |
Income Below Poverty Among Married-Couple vs Single-Parent Households in Nye County
The poverty data for Nye County shows that 872 of the married-couple family households (8.5%) and 483 of the single-parent households (15.8%) are living below the poverty level. Within the married-couple family households, those with 5 or more children have the highest poverty rate, with 11 households (21.6%) falling below the poverty line. Among the single-parent households, those with 5 or more children have the highest poverty rate, with 16 household (100.0%) living below poverty.
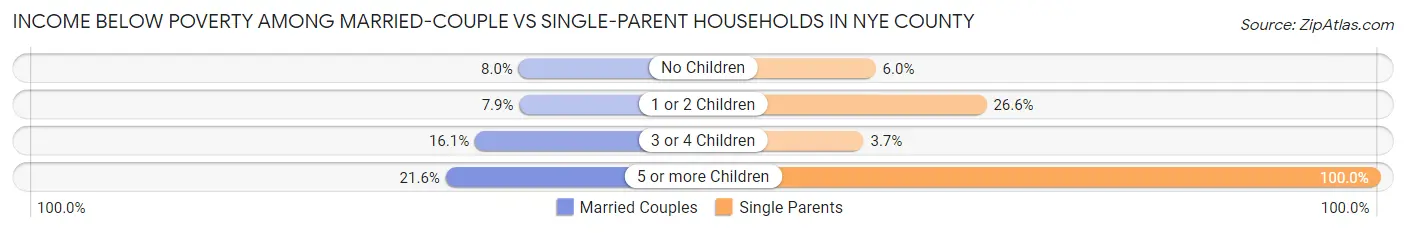
| Children | Married-Couple Families | Single-Parent Households |
| No Children | 623 (8.0%) | 91 (6.0%) |
| 1 or 2 Children | 142 (7.9%) | 372 (26.6%) |
| 3 or 4 Children | 96 (16.1%) | 4 (3.7%) |
| 5 or more Children | 11 (21.6%) | 16 (100.0%) |
| Total | 872 (8.5%) | 483 (15.8%) |
Race in Nye County
The most populous races in Nye County are White / Caucasian (39,991 | 77.4%), Hispanic or Latino (8,360 | 16.2%), and Two or more Races (5,091 | 9.9%).
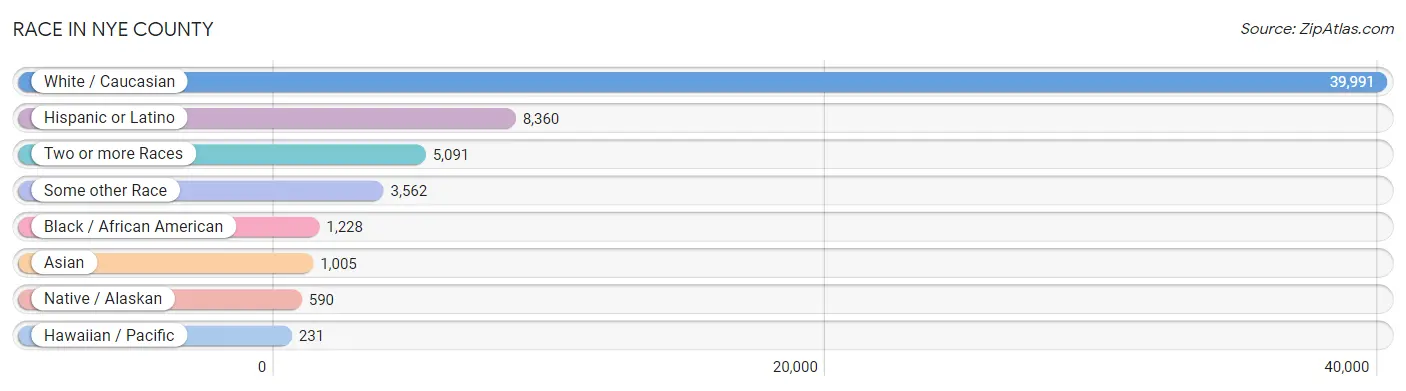
| Race | # Population | % Population |
| Asian | 1,005 | 1.9% |
| Black / African American | 1,228 | 2.4% |
| Hawaiian / Pacific | 231 | 0.4% |
| Hispanic or Latino | 8,360 | 16.2% |
| Native / Alaskan | 590 | 1.1% |
| White / Caucasian | 39,991 | 77.4% |
| Two or more Races | 5,091 | 9.9% |
| Some other Race | 3,562 | 6.9% |
| Total | 51,698 | 100.0% |
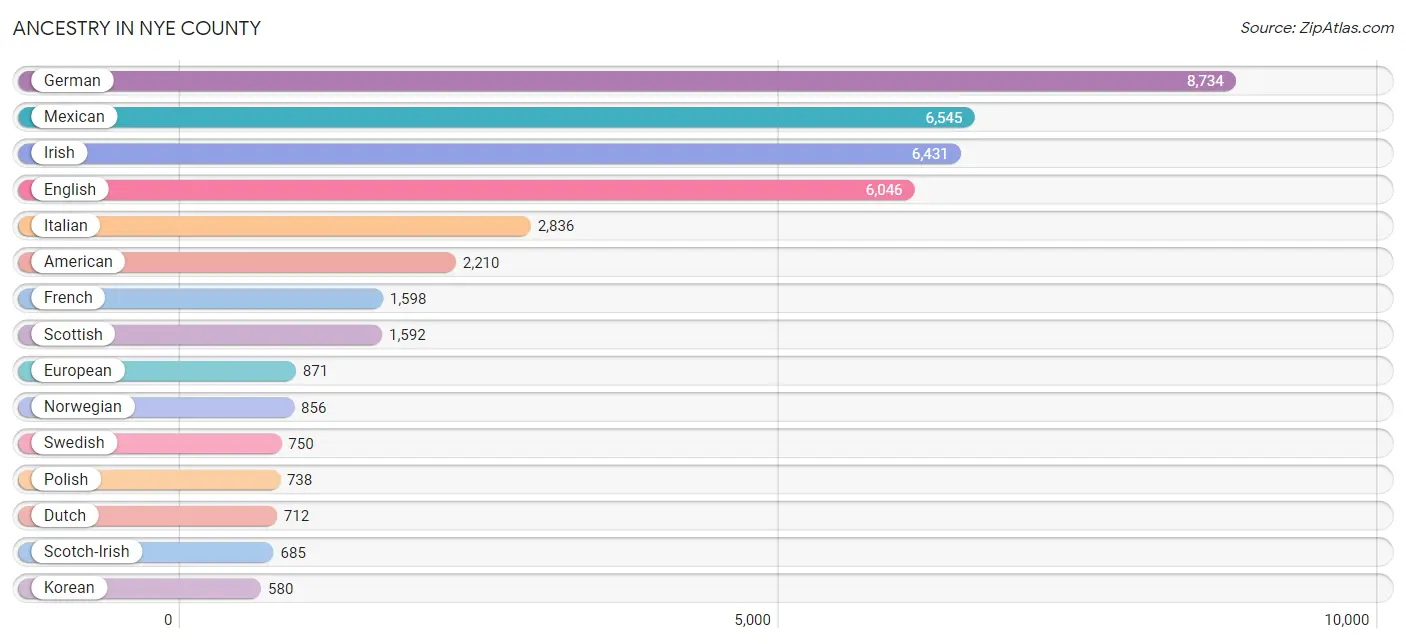
Ancestry in Nye County
The most populous ancestries reported in Nye County are German (8,734 | 16.9%), Mexican (6,545 | 12.7%), Irish (6,431 | 12.4%), English (6,046 | 11.7%), and Italian (2,836 | 5.5%), together accounting for 59.2% of all Nye County residents.
| Ancestry | # Population | % Population |
| African | 309 | 0.6% |
| Alaska Native | 20 | 0.0% |
| American | 2,210 | 4.3% |
| Arab | 45 | 0.1% |
| Argentinean | 60 | 0.1% |
| Austrian | 33 | 0.1% |
| Basque | 35 | 0.1% |
| Belgian | 58 | 0.1% |
| Bhutanese | 201 | 0.4% |
| Blackfeet | 4 | 0.0% |
| Bolivian | 65 | 0.1% |
| British | 85 | 0.2% |
| Burmese | 150 | 0.3% |
| Canadian | 89 | 0.2% |
| Central American | 565 | 1.1% |
| Cherokee | 414 | 0.8% |
| Chinese | 2 | 0.0% |
| Chippewa | 18 | 0.0% |
| Choctaw | 19 | 0.0% |
| Costa Rican | 31 | 0.1% |
| Croatian | 47 | 0.1% |
| Cuban | 175 | 0.3% |
| Czech | 165 | 0.3% |
| Czechoslovakian | 27 | 0.1% |
| Danish | 195 | 0.4% |
| Dutch | 712 | 1.4% |
| Eastern European | 69 | 0.1% |
| Ecuadorian | 14 | 0.0% |
| English | 6,046 | 11.7% |
| European | 871 | 1.7% |
| Filipino | 28 | 0.1% |
| Finnish | 39 | 0.1% |
| French | 1,598 | 3.1% |
| French Canadian | 108 | 0.2% |
| German | 8,734 | 16.9% |
| Greek | 46 | 0.1% |
| Guamanian / Chamorro | 74 | 0.1% |
| Guatemalan | 176 | 0.3% |
| Honduran | 14 | 0.0% |
| Hungarian | 265 | 0.5% |
| Indian (Asian) | 236 | 0.5% |
| Iraqi | 11 | 0.0% |
| Irish | 6,431 | 12.4% |
| Iroquois | 10 | 0.0% |
| Italian | 2,836 | 5.5% |
| Jamaican | 122 | 0.2% |
| Japanese | 286 | 0.5% |
| Korean | 580 | 1.1% |
| Lebanese | 45 | 0.1% |
| Lithuanian | 38 | 0.1% |
| Luxembourger | 18 | 0.0% |
| Maltese | 41 | 0.1% |
| Mexican | 6,545 | 12.7% |
| Mexican American Indian | 10 | 0.0% |
| Native Hawaiian | 409 | 0.8% |
| Navajo | 9 | 0.0% |
| Nigerian | 138 | 0.3% |
| Northern European | 50 | 0.1% |
| Norwegian | 856 | 1.7% |
| Osage | 7 | 0.0% |
| Paiute | 72 | 0.1% |
| Pakistani | 40 | 0.1% |
| Polish | 738 | 1.4% |
| Portuguese | 231 | 0.4% |
| Puerto Rican | 158 | 0.3% |
| Romanian | 30 | 0.1% |
| Russian | 328 | 0.6% |
| Salvadoran | 344 | 0.7% |
| Scandinavian | 441 | 0.9% |
| Scotch-Irish | 685 | 1.3% |
| Scottish | 1,592 | 3.1% |
| Serbian | 55 | 0.1% |
| Shoshone | 154 | 0.3% |
| Sioux | 60 | 0.1% |
| Slovak | 33 | 0.1% |
| Somali | 50 | 0.1% |
| South American | 181 | 0.4% |
| Spaniard | 352 | 0.7% |
| Spanish | 202 | 0.4% |
| Sri Lankan | 41 | 0.1% |
| Subsaharan African | 497 | 1.0% |
| Swedish | 750 | 1.5% |
| Swiss | 169 | 0.3% |
| Thai | 51 | 0.1% |
| Ukrainian | 215 | 0.4% |
| Welsh | 307 | 0.6% |
| Yaqui | 3 | 0.0% |
| Yugoslavian | 82 | 0.2% | View All 88 Rows |
Immigrants in Nye County
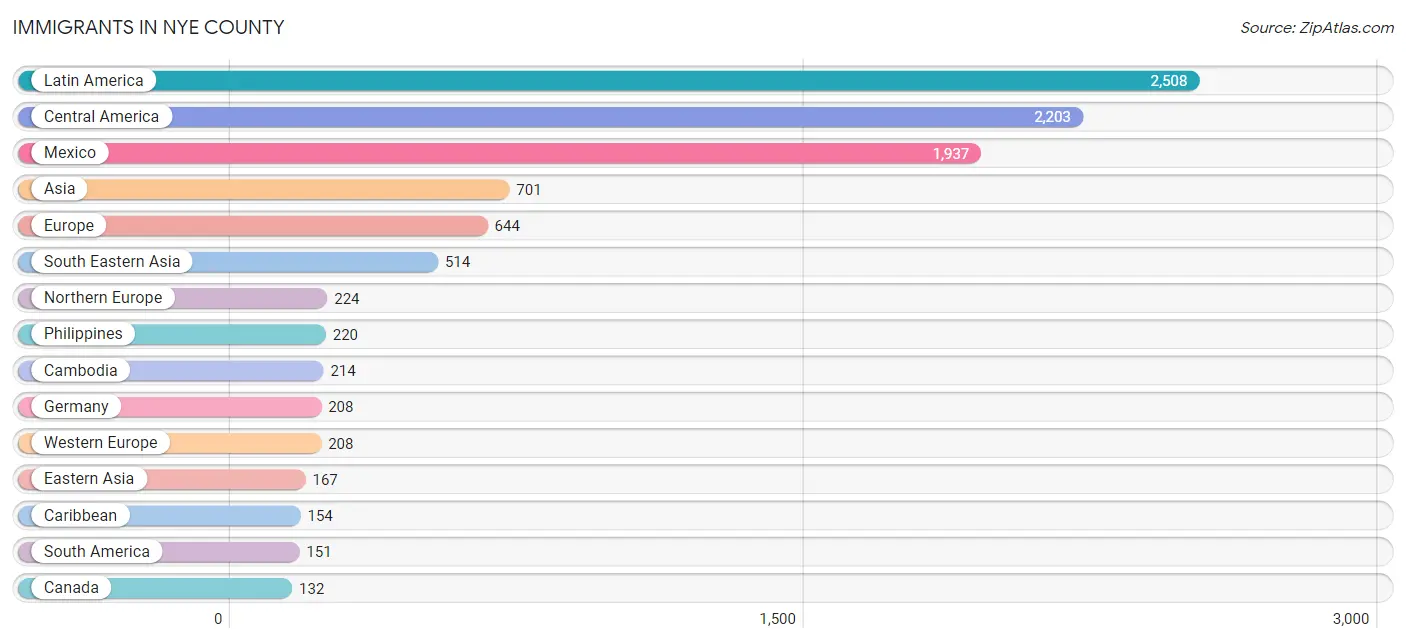
The most numerous immigrant groups reported in Nye County came from Latin America (2,508 | 4.9%), Central America (2,203 | 4.3%), Mexico (1,937 | 3.7%), Asia (701 | 1.4%), and Europe (644 | 1.3%), together accounting for 15.5% of all Nye County residents.
| Immigration Origin | # Population | % Population |
| Argentina | 60 | 0.1% |
| Asia | 701 | 1.4% |
| Australia | 17 | 0.0% |
| Belize | 14 | 0.0% |
| Cambodia | 214 | 0.4% |
| Canada | 132 | 0.3% |
| Caribbean | 154 | 0.3% |
| Central America | 2,203 | 4.3% |
| China | 55 | 0.1% |
| Costa Rica | 31 | 0.1% |
| Cuba | 27 | 0.1% |
| Czechoslovakia | 55 | 0.1% |
| Denmark | 51 | 0.1% |
| Eastern Asia | 167 | 0.3% |
| Eastern Europe | 122 | 0.2% |
| Ecuador | 14 | 0.0% |
| El Salvador | 129 | 0.3% |
| England | 103 | 0.2% |
| Europe | 644 | 1.3% |
| Germany | 208 | 0.4% |
| Guatemala | 78 | 0.2% |
| Honduras | 14 | 0.0% |
| India | 4 | 0.0% |
| Indonesia | 47 | 0.1% |
| Ireland | 13 | 0.0% |
| Italy | 49 | 0.1% |
| Jamaica | 127 | 0.3% |
| Japan | 2 | 0.0% |
| Korea | 110 | 0.2% |
| Latin America | 2,508 | 4.9% |
| Lebanon | 11 | 0.0% |
| Mexico | 1,937 | 3.7% |
| Northern Europe | 224 | 0.4% |
| Oceania | 17 | 0.0% |
| Pakistan | 5 | 0.0% |
| Philippines | 220 | 0.4% |
| Poland | 25 | 0.1% |
| Romania | 12 | 0.0% |
| Russia | 18 | 0.0% |
| Scotland | 22 | 0.0% |
| South America | 151 | 0.3% |
| South Central Asia | 9 | 0.0% |
| South Eastern Asia | 514 | 1.0% |
| Southern Europe | 90 | 0.2% |
| Sweden | 17 | 0.0% |
| Taiwan | 20 | 0.0% |
| Thailand | 33 | 0.1% |
| Ukraine | 12 | 0.0% |
| Uruguay | 35 | 0.1% |
| Western Asia | 11 | 0.0% |
| Western Europe | 208 | 0.4% | View All 51 Rows |
Sex and Age in Nye County
Sex and Age in Nye County
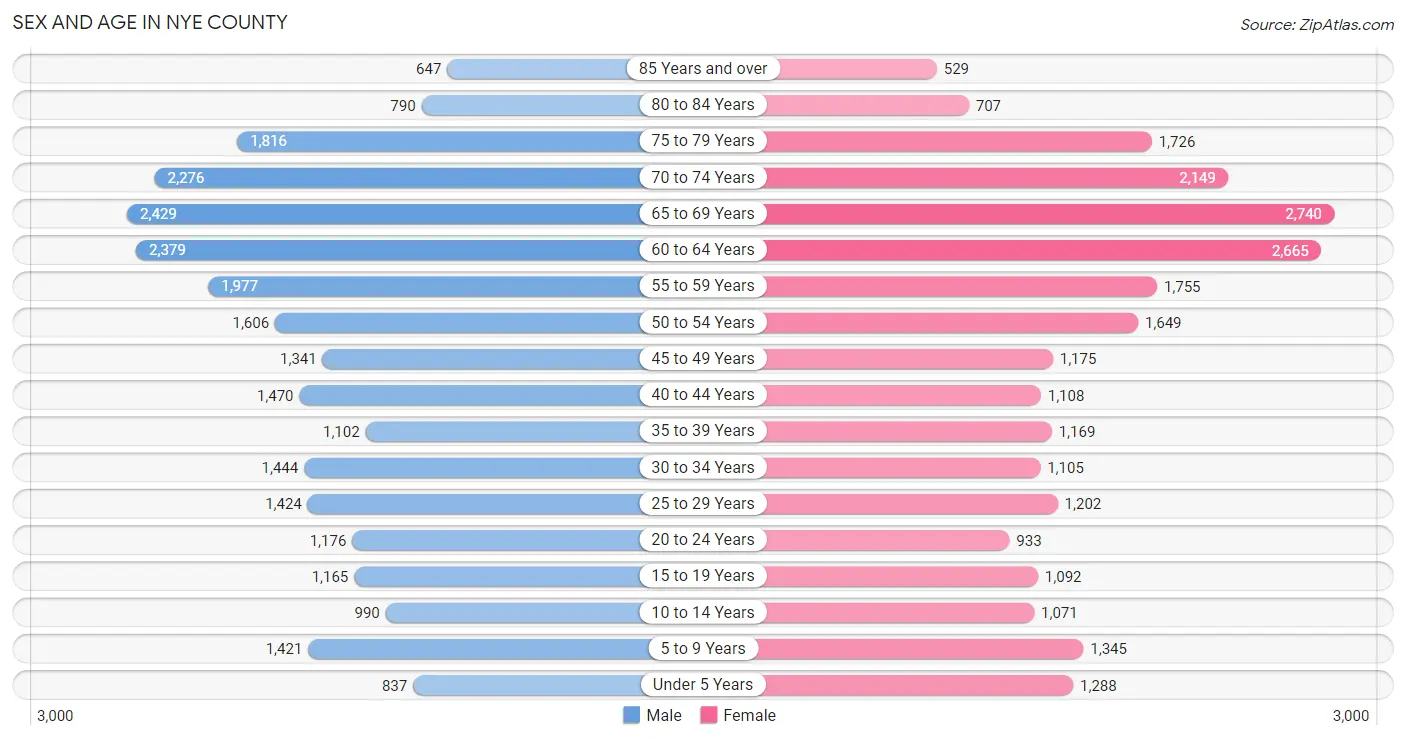
The most populous age groups in Nye County are 65 to 69 Years (2,429 | 9.2%) for men and 65 to 69 Years (2,740 | 10.8%) for women.
| Age Bracket | Male | Female |
| Under 5 Years | 837 (3.2%) | 1,288 (5.1%) |
| 5 to 9 Years | 1,421 (5.4%) | 1,345 (5.3%) |
| 10 to 14 Years | 990 (3.8%) | 1,071 (4.2%) |
| 15 to 19 Years | 1,165 (4.4%) | 1,092 (4.3%) |
| 20 to 24 Years | 1,176 (4.5%) | 933 (3.7%) |
| 25 to 29 Years | 1,424 (5.4%) | 1,202 (4.7%) |
| 30 to 34 Years | 1,444 (5.5%) | 1,105 (4.3%) |
| 35 to 39 Years | 1,102 (4.2%) | 1,169 (4.6%) |
| 40 to 44 Years | 1,470 (5.6%) | 1,108 (4.4%) |
| 45 to 49 Years | 1,341 (5.1%) | 1,175 (4.6%) |
| 50 to 54 Years | 1,606 (6.1%) | 1,649 (6.5%) |
| 55 to 59 Years | 1,977 (7.5%) | 1,755 (6.9%) |
| 60 to 64 Years | 2,379 (9.0%) | 2,665 (10.5%) |
| 65 to 69 Years | 2,429 (9.2%) | 2,740 (10.8%) |
| 70 to 74 Years | 2,276 (8.7%) | 2,149 (8.5%) |
| 75 to 79 Years | 1,816 (6.9%) | 1,726 (6.8%) |
| 80 to 84 Years | 790 (3.0%) | 707 (2.8%) |
| 85 Years and over | 647 (2.5%) | 529 (2.1%) |
| Total | 26,290 (100.0%) | 25,408 (100.0%) |
Families and Households in Nye County
Median Family Size in Nye County
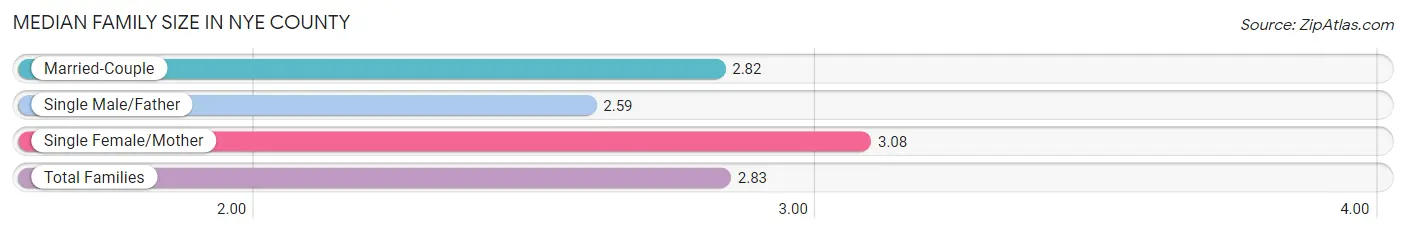
The median family size in Nye County is 2.83 persons per family, with single female/mother families (1,741 | 13.1%) accounting for the largest median family size of 3.08 persons per family. On the other hand, single male/father families (1,309 | 9.8%) represent the smallest median family size with 2.59 persons per family.
| Family Type | # Families | Family Size |
| Married-Couple | 10,275 (77.1%) | 2.82 |
| Single Male/Father | 1,309 (9.8%) | 2.59 |
| Single Female/Mother | 1,741 (13.1%) | 3.08 |
| Total Families | 13,325 (100.0%) | 2.83 |
Median Household Size in Nye County
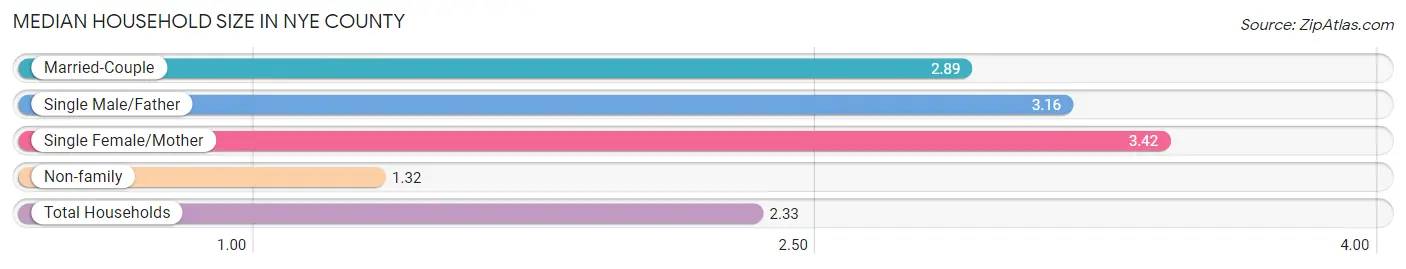
The median household size in Nye County is 2.33 persons per household, with single female/mother households (1,741 | 8.0%) accounting for the largest median household size of 3.42 persons per household. non-family households (8,522 | 39.0%) represent the smallest median household size with 1.32 persons per household.
| Household Type | # Households | Household Size |
| Married-Couple | 10,275 (47.0%) | 2.89 |
| Single Male/Father | 1,309 (6.0%) | 3.16 |
| Single Female/Mother | 1,741 (8.0%) | 3.42 |
| Non-family | 8,522 (39.0%) | 1.32 |
| Total Households | 21,847 (100.0%) | 2.33 |
Household Size by Marriage Status in Nye County
Out of a total of 21,847 households in Nye County, 13,325 (61.0%) are family households, while 8,522 (39.0%) are nonfamily households. The most numerous type of family households are 2-person households, comprising 7,646, and the most common type of nonfamily households are 1-person households, comprising 6,315.
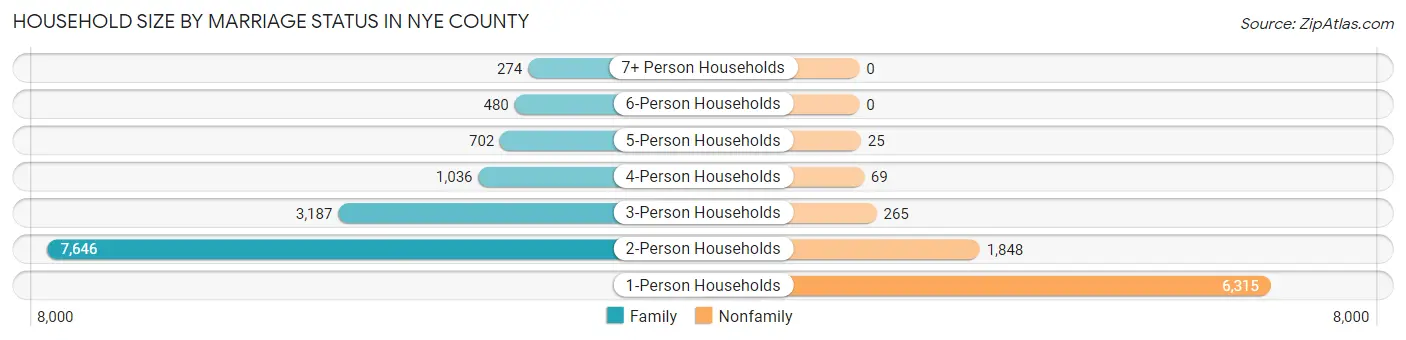
| Household Size | Family Households | Nonfamily Households |
| 1-Person Households | - | 6,315 (28.9%) |
| 2-Person Households | 7,646 (35.0%) | 1,848 (8.5%) |
| 3-Person Households | 3,187 (14.6%) | 265 (1.2%) |
| 4-Person Households | 1,036 (4.7%) | 69 (0.3%) |
| 5-Person Households | 702 (3.2%) | 25 (0.1%) |
| 6-Person Households | 480 (2.2%) | 0 (0.0%) |
| 7+ Person Households | 274 (1.3%) | 0 (0.0%) |
| Total | 13,325 (61.0%) | 8,522 (39.0%) |
Female Fertility in Nye County
Fertility by Age in Nye County
Average fertility rate in Nye County is 50.0 births per 1,000 women. Women in the age bracket of 20 to 34 years have the highest fertility rate with 80.0 births per 1,000 women. Women in the age bracket of 20 to 34 years acount for 63.7% of all women with births.
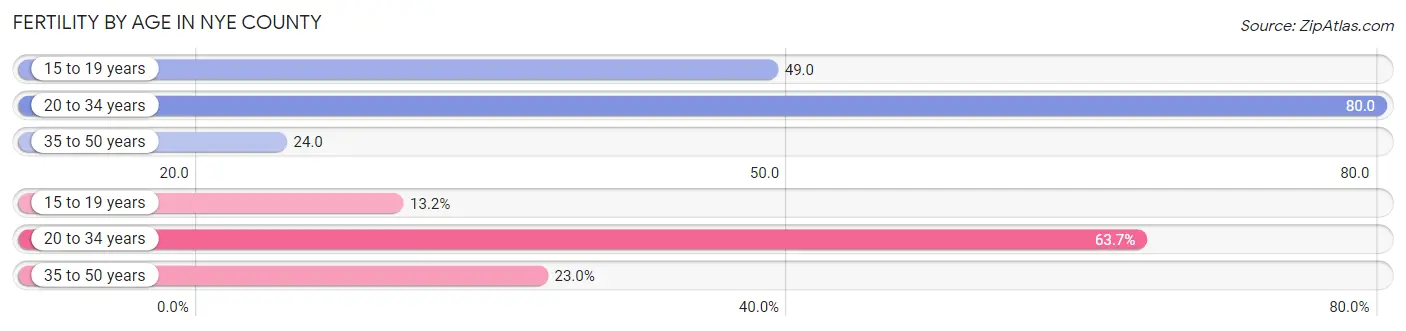
| Age Bracket | Women with Births | Births / 1,000 Women |
| 15 to 19 years | 54 (13.2%) | 49.0 |
| 20 to 34 years | 260 (63.7%) | 80.0 |
| 35 to 50 years | 94 (23.0%) | 24.0 |
| Total | 408 (100.0%) | 50.0 |
Fertility by Age by Marriage Status in Nye County
61.5% of women with births (408) in Nye County are married. The highest percentage of unmarried women with births falls into 15 to 19 years age bracket with 100.0% of them unmarried at the time of birth, while the lowest percentage of unmarried women with births belong to 20 to 34 years age bracket with 16.9% of them unmarried.
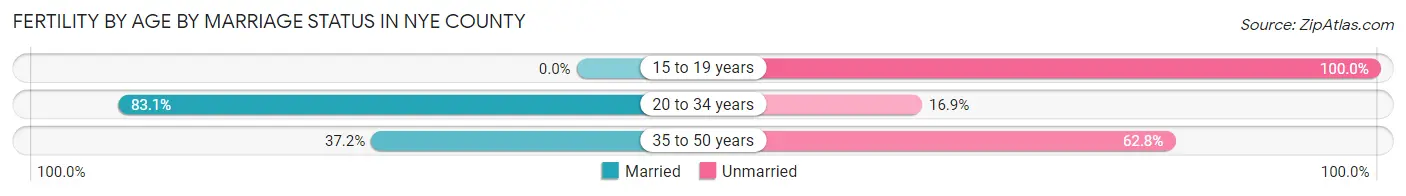
| Age Bracket | Married | Unmarried |
| 15 to 19 years | 0 (0.0%) | 54 (100.0%) |
| 20 to 34 years | 216 (83.1%) | 44 (16.9%) |
| 35 to 50 years | 35 (37.2%) | 59 (62.8%) |
| Total | 251 (61.5%) | 157 (38.5%) |
Fertility by Education in Nye County
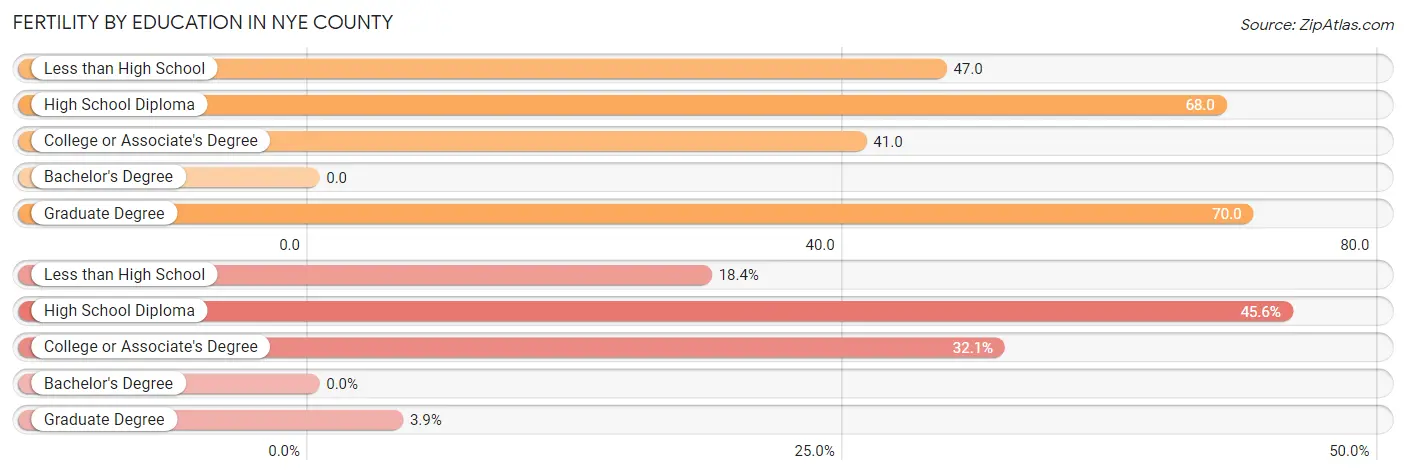
| Educational Attainment | Women with Births | Births / 1,000 Women |
| Less than High School | 75 (18.4%) | 47.0 |
| High School Diploma | 186 (45.6%) | 68.0 |
| College or Associate's Degree | 131 (32.1%) | 41.0 |
| Bachelor's Degree | 0 (0.0%) | 0.0 |
| Graduate Degree | 16 (3.9%) | 70.0 |
| Total | 408 (100.0%) | 50.0 |
Fertility by Education by Marriage Status in Nye County
38.5% of women with births in Nye County are unmarried. Women with the educational attainment of graduate degree are most likely to be married with 100.0% of them married at childbirth, while women with the educational attainment of college or associate's degree are least likely to be married with 60.3% of them unmarried at childbirth.
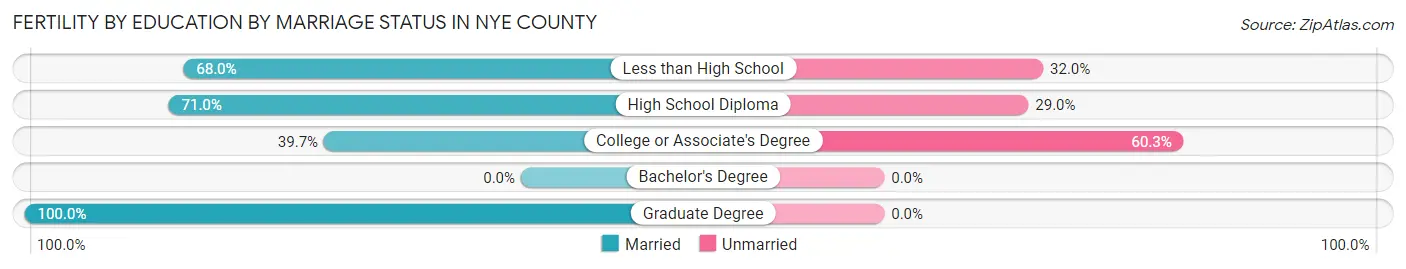
| Educational Attainment | Married | Unmarried |
| Less than High School | 51 (68.0%) | 24 (32.0%) |
| High School Diploma | 132 (71.0%) | 54 (29.0%) |
| College or Associate's Degree | 52 (39.7%) | 79 (60.3%) |
| Bachelor's Degree | 0 (0.0%) | 0 (0.0%) |
| Graduate Degree | 16 (100.0%) | 0 (0.0%) |
| Total | 251 (61.5%) | 157 (38.5%) |
Employment Characteristics in Nye County
Employment by Class of Employer in Nye County
Among the 16,552 employed individuals in Nye County, private company employees (11,665 | 70.5%), local government employees (1,528 | 9.2%), and self-employed (not incorporated) (999 | 6.0%) make up the most common classes of employment.
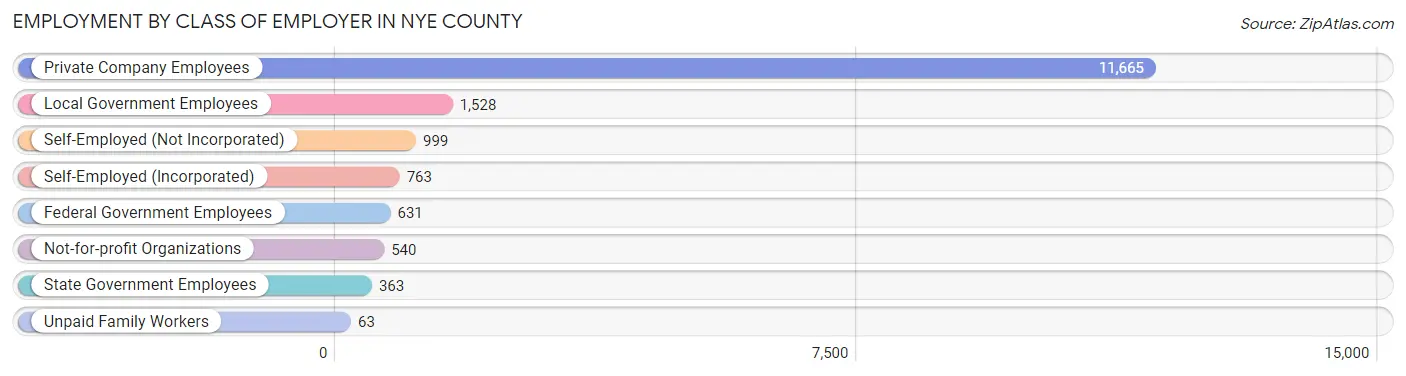
| Employer Class | # Employees | % Employees |
| Private Company Employees | 11,665 | 70.5% |
| Self-Employed (Incorporated) | 763 | 4.6% |
| Self-Employed (Not Incorporated) | 999 | 6.0% |
| Not-for-profit Organizations | 540 | 3.3% |
| Local Government Employees | 1,528 | 9.2% |
| State Government Employees | 363 | 2.2% |
| Federal Government Employees | 631 | 3.8% |
| Unpaid Family Workers | 63 | 0.4% |
| Total | 16,552 | 100.0% |
Employment Status by Age in Nye County
According to the labor force statistics for Nye County, out of the total population over 16 years of age (44,286), 41.8% or 18,512 individuals are in the labor force, with 9.3% or 1,722 of them unemployed. The age group with the highest labor force participation rate is 25 to 29 years, with 77.9% or 2,046 individuals in the labor force. Within the labor force, the 25 to 29 years age range has the highest percentage of unemployed individuals, with 18.7% or 383 of them being unemployed.
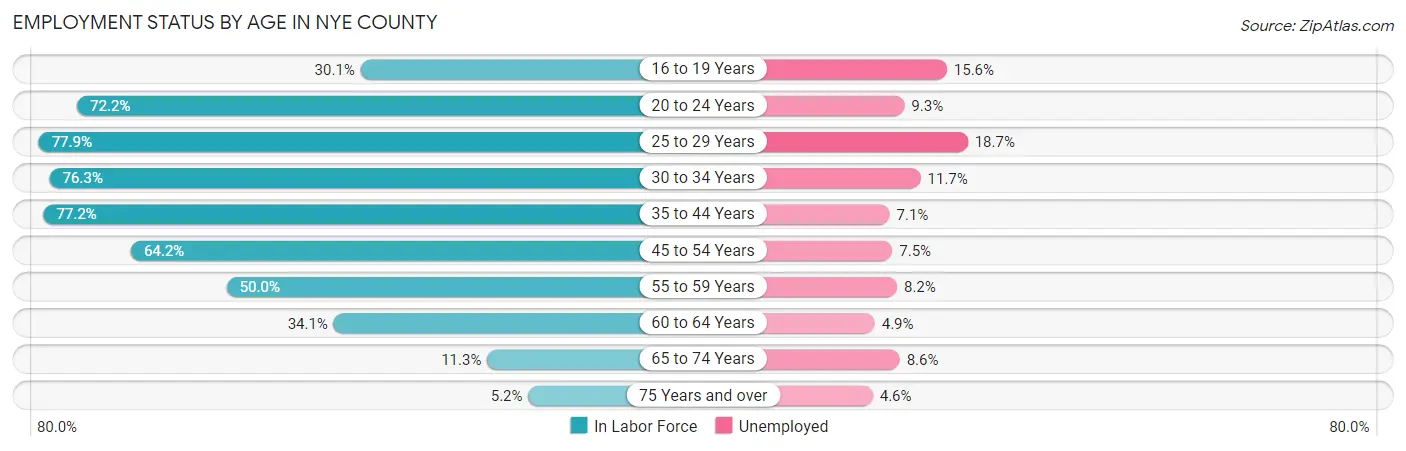
| Age Bracket | In Labor Force | Unemployed |
| 16 to 19 Years | 541 (30.1%) | 84 (15.6%) |
| 20 to 24 Years | 1,523 (72.2%) | 142 (9.3%) |
| 25 to 29 Years | 2,046 (77.9%) | 383 (18.7%) |
| 30 to 34 Years | 1,945 (76.3%) | 228 (11.7%) |
| 35 to 44 Years | 3,743 (77.2%) | 266 (7.1%) |
| 45 to 54 Years | 3,705 (64.2%) | 278 (7.5%) |
| 55 to 59 Years | 1,866 (50.0%) | 153 (8.2%) |
| 60 to 64 Years | 1,720 (34.1%) | 84 (4.9%) |
| 65 to 74 Years | 1,084 (11.3%) | 93 (8.6%) |
| 75 Years and over | 323 (5.2%) | 15 (4.6%) |
| Total | 18,512 (41.8%) | 1,722 (9.3%) |
Employment Status by Educational Attainment in Nye County
According to labor force statistics for Nye County, 61.2% of individuals (15,037) out of the total population between 25 and 64 years of age (24,571) are in the labor force, with 9.3% or 1,398 of them being unemployed. The group with the highest labor force participation rate are those with the educational attainment of bachelor's degree or higher, with 73.7% or 1,736 individuals in the labor force. Within the labor force, individuals with less than high school education have the highest percentage of unemployment, with 11.0% or 154 of them being unemployed.
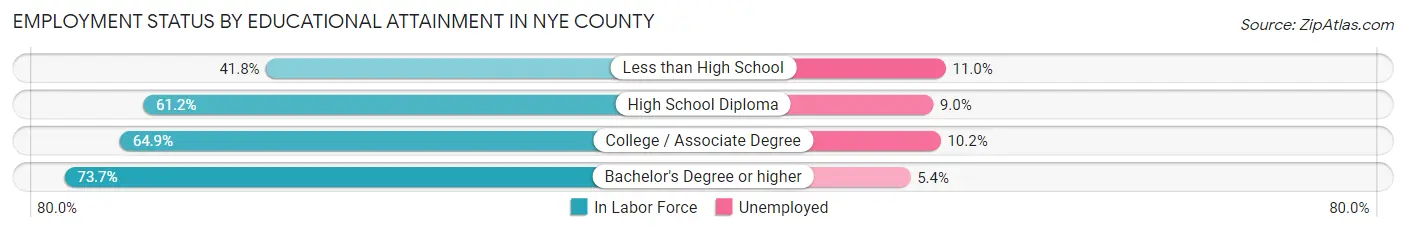
| Educational Attainment | In Labor Force | Unemployed |
| Less than High School | 1,400 (41.8%) | 368 (11.0%) |
| High School Diploma | 5,842 (61.2%) | 859 (9.0%) |
| College / Associate Degree | 6,050 (64.9%) | 951 (10.2%) |
| Bachelor's Degree or higher | 1,736 (73.7%) | 127 (5.4%) |
| Total | 15,037 (61.2%) | 2,285 (9.3%) |
Employment Occupations by Sex in Nye County
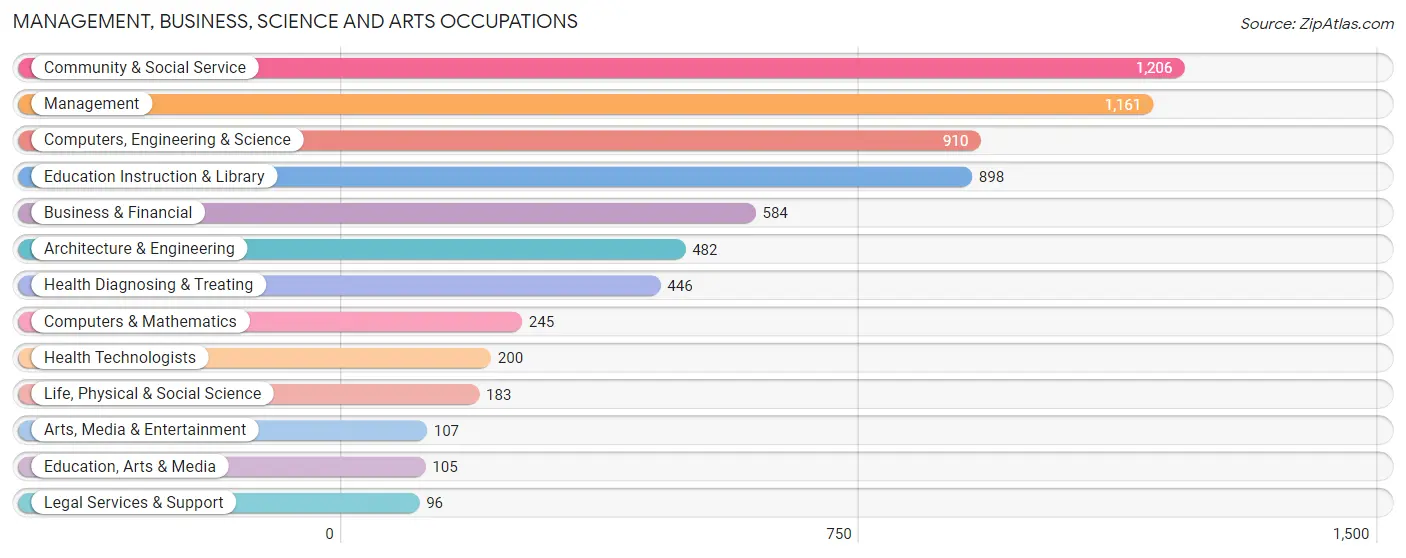
Management, Business, Science and Arts Occupations
The most common Management, Business, Science and Arts occupations in Nye County are Community & Social Service (1,206 | 7.2%), Management (1,161 | 6.9%), Computers, Engineering & Science (910 | 5.4%), Education Instruction & Library (898 | 5.3%), and Business & Financial (584 | 3.5%).
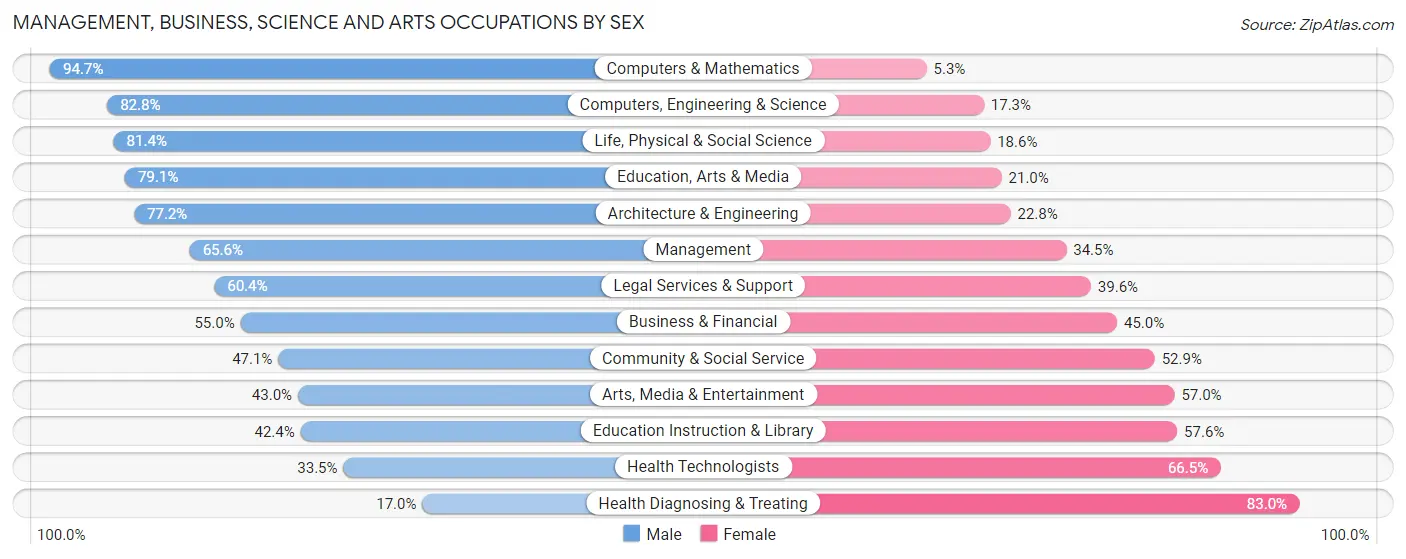
Management, Business, Science and Arts Occupations by Sex
Within the Management, Business, Science and Arts occupations in Nye County, the most male-oriented occupations are Computers & Mathematics (94.7%), Computers, Engineering & Science (82.8%), and Life, Physical & Social Science (81.4%), while the most female-oriented occupations are Health Diagnosing & Treating (83.0%), Health Technologists (66.5%), and Education Instruction & Library (57.6%).
| Occupation | Male | Female |
| Management | 761 (65.5%) | 400 (34.4%) |
| Business & Financial | 321 (55.0%) | 263 (45.0%) |
| Computers, Engineering & Science | 753 (82.8%) | 157 (17.2%) |
| Computers & Mathematics | 232 (94.7%) | 13 (5.3%) |
| Architecture & Engineering | 372 (77.2%) | 110 (22.8%) |
| Life, Physical & Social Science | 149 (81.4%) | 34 (18.6%) |
| Community & Social Service | 568 (47.1%) | 638 (52.9%) |
| Education, Arts & Media | 83 (79.0%) | 22 (20.9%) |
| Legal Services & Support | 58 (60.4%) | 38 (39.6%) |
| Education Instruction & Library | 381 (42.4%) | 517 (57.6%) |
| Arts, Media & Entertainment | 46 (43.0%) | 61 (57.0%) |
| Health Diagnosing & Treating | 76 (17.0%) | 370 (83.0%) |
| Health Technologists | 67 (33.5%) | 133 (66.5%) |
| Total (Category) | 2,479 (57.6%) | 1,828 (42.4%) |
| Total (Overall) | 9,951 (59.3%) | 6,824 (40.7%) |
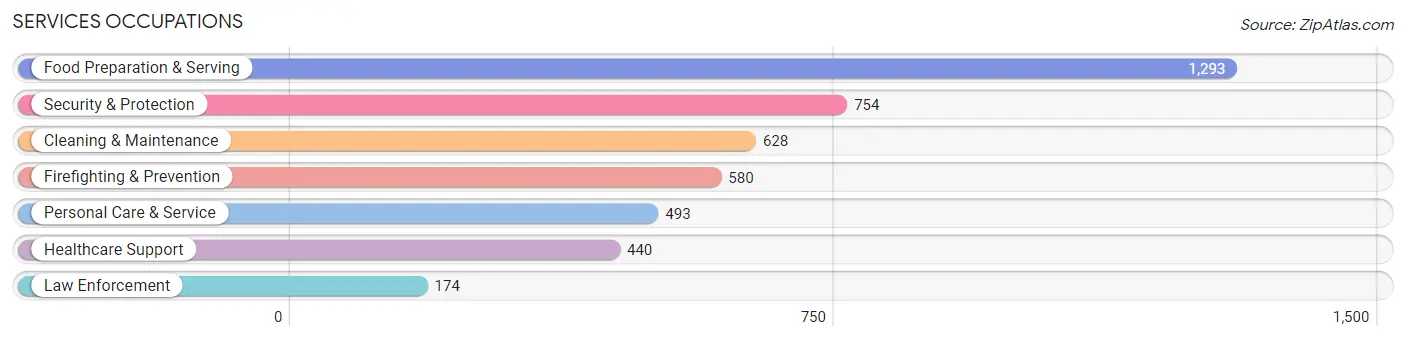
Services Occupations
The most common Services occupations in Nye County are Food Preparation & Serving (1,293 | 7.7%), Security & Protection (754 | 4.5%), Cleaning & Maintenance (628 | 3.7%), Firefighting & Prevention (580 | 3.5%), and Personal Care & Service (493 | 2.9%).
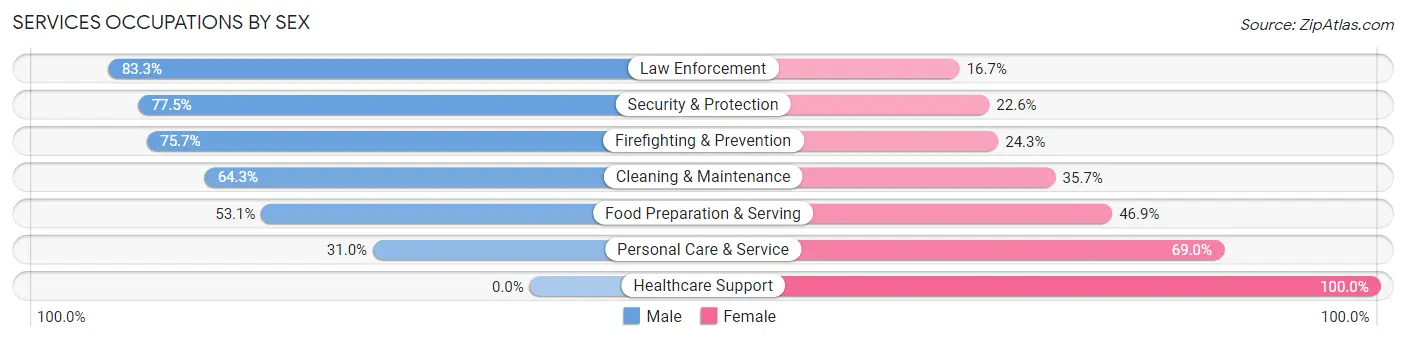
Services Occupations by Sex
Within the Services occupations in Nye County, the most male-oriented occupations are Law Enforcement (83.3%), Security & Protection (77.4%), and Firefighting & Prevention (75.7%), while the most female-oriented occupations are Healthcare Support (100.0%), Personal Care & Service (69.0%), and Food Preparation & Serving (46.9%).
| Occupation | Male | Female |
| Healthcare Support | 0 (0.0%) | 440 (100.0%) |
| Security & Protection | 584 (77.4%) | 170 (22.6%) |
| Firefighting & Prevention | 439 (75.7%) | 141 (24.3%) |
| Law Enforcement | 145 (83.3%) | 29 (16.7%) |
| Food Preparation & Serving | 687 (53.1%) | 606 (46.9%) |
| Cleaning & Maintenance | 404 (64.3%) | 224 (35.7%) |
| Personal Care & Service | 153 (31.0%) | 340 (69.0%) |
| Total (Category) | 1,828 (50.7%) | 1,780 (49.3%) |
| Total (Overall) | 9,951 (59.3%) | 6,824 (40.7%) |
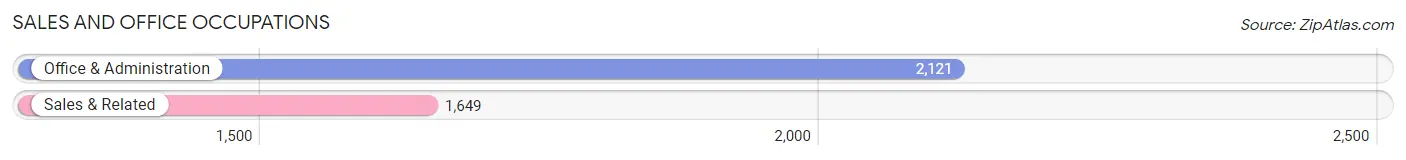
Sales and Office Occupations
The most common Sales and Office occupations in Nye County are Office & Administration (2,121 | 12.6%), and Sales & Related (1,649 | 9.8%).
Sales and Office Occupations by Sex
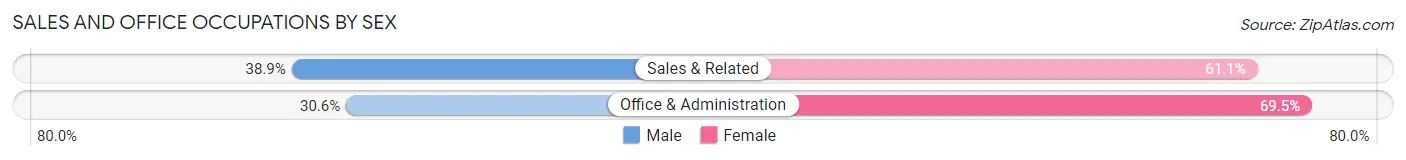
| Occupation | Male | Female |
| Sales & Related | 642 (38.9%) | 1,007 (61.1%) |
| Office & Administration | 648 (30.5%) | 1,473 (69.5%) |
| Total (Category) | 1,290 (34.2%) | 2,480 (65.8%) |
| Total (Overall) | 9,951 (59.3%) | 6,824 (40.7%) |
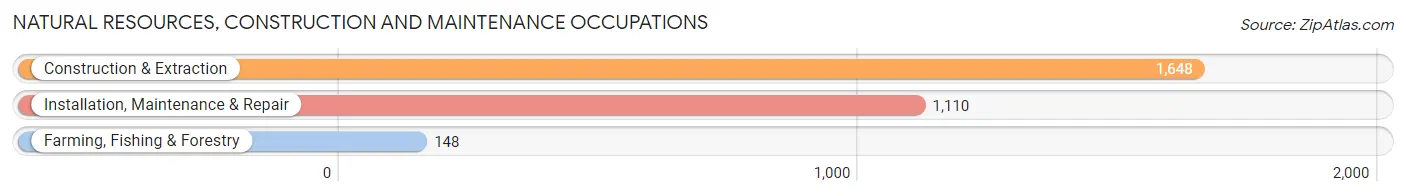
Natural Resources, Construction and Maintenance Occupations
The most common Natural Resources, Construction and Maintenance occupations in Nye County are Construction & Extraction (1,648 | 9.8%), Installation, Maintenance & Repair (1,110 | 6.6%), and Farming, Fishing & Forestry (148 | 0.9%).
Natural Resources, Construction and Maintenance Occupations by Sex
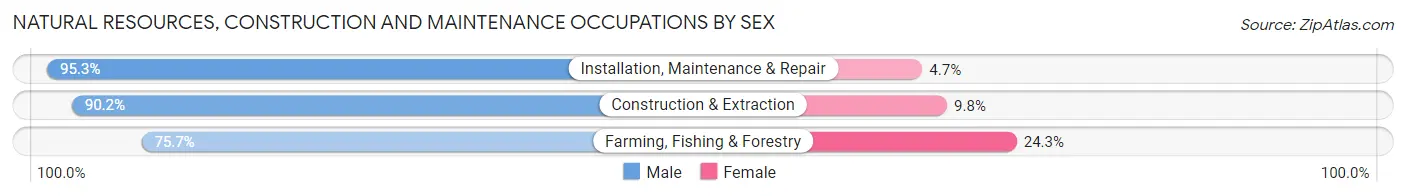
| Occupation | Male | Female |
| Farming, Fishing & Forestry | 112 (75.7%) | 36 (24.3%) |
| Construction & Extraction | 1,486 (90.2%) | 162 (9.8%) |
| Installation, Maintenance & Repair | 1,058 (95.3%) | 52 (4.7%) |
| Total (Category) | 2,656 (91.4%) | 250 (8.6%) |
| Total (Overall) | 9,951 (59.3%) | 6,824 (40.7%) |
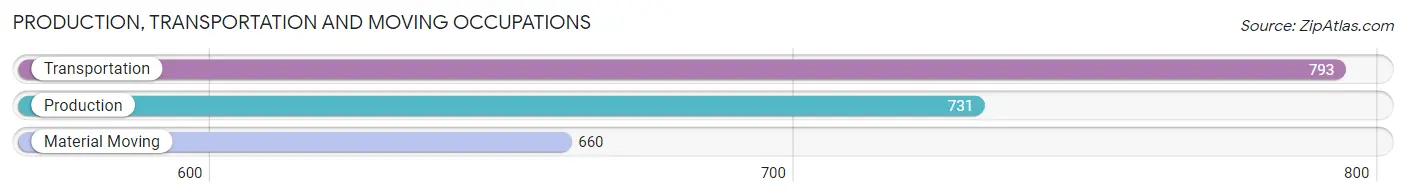
Production, Transportation and Moving Occupations
The most common Production, Transportation and Moving occupations in Nye County are Transportation (793 | 4.7%), Production (731 | 4.4%), and Material Moving (660 | 3.9%).
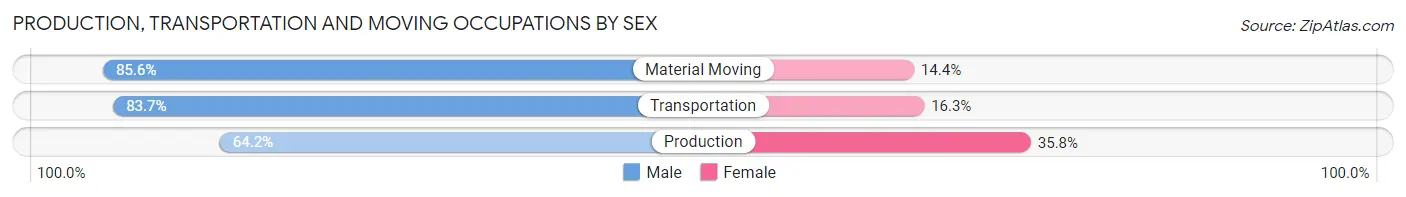
Production, Transportation and Moving Occupations by Sex
| Occupation | Male | Female |
| Production | 469 (64.2%) | 262 (35.8%) |
| Transportation | 664 (83.7%) | 129 (16.3%) |
| Material Moving | 565 (85.6%) | 95 (14.4%) |
| Total (Category) | 1,698 (77.7%) | 486 (22.3%) |
| Total (Overall) | 9,951 (59.3%) | 6,824 (40.7%) |
Employment Industries by Sex in Nye County
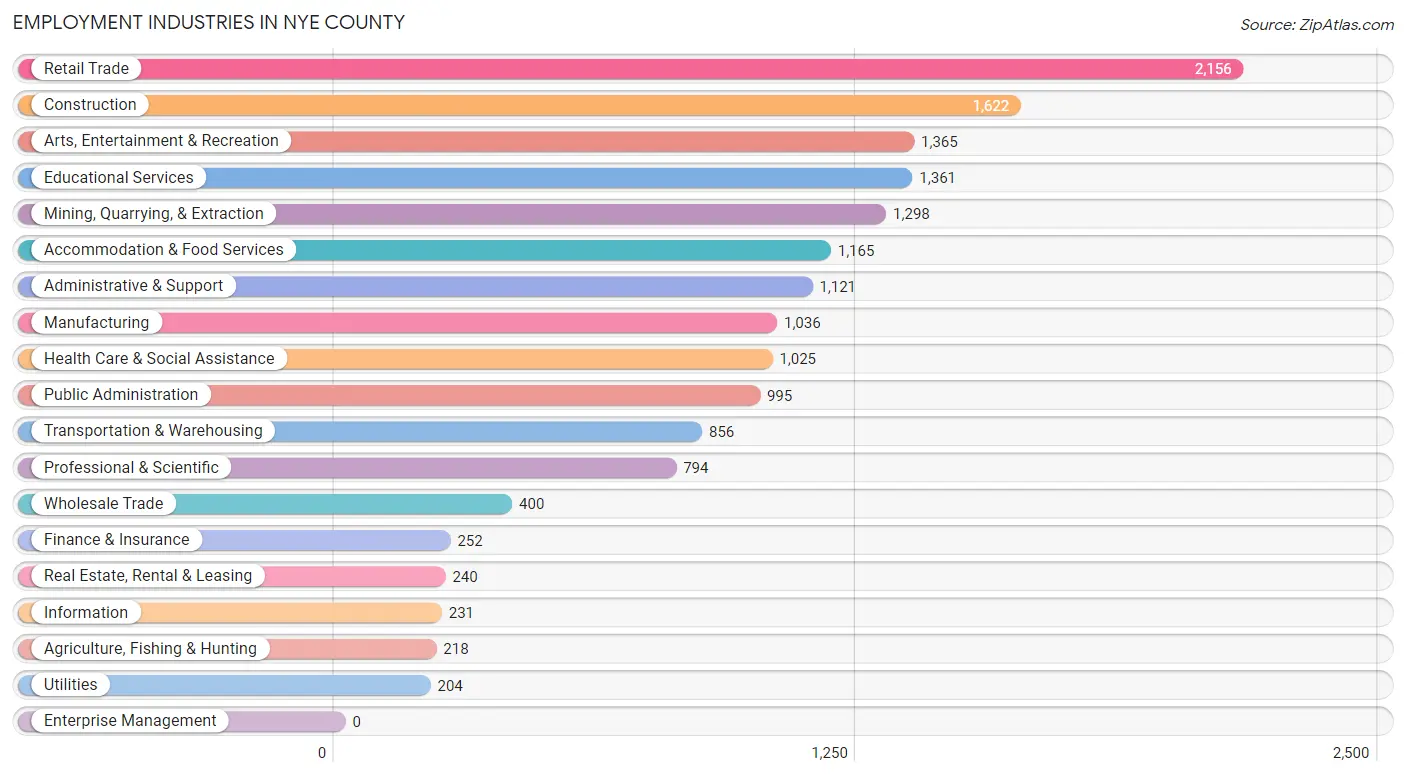
Employment Industries in Nye County
The major employment industries in Nye County include Retail Trade (2,156 | 12.9%), Construction (1,622 | 9.7%), Arts, Entertainment & Recreation (1,365 | 8.1%), Educational Services (1,361 | 8.1%), and Mining, Quarrying, & Extraction (1,298 | 7.7%).
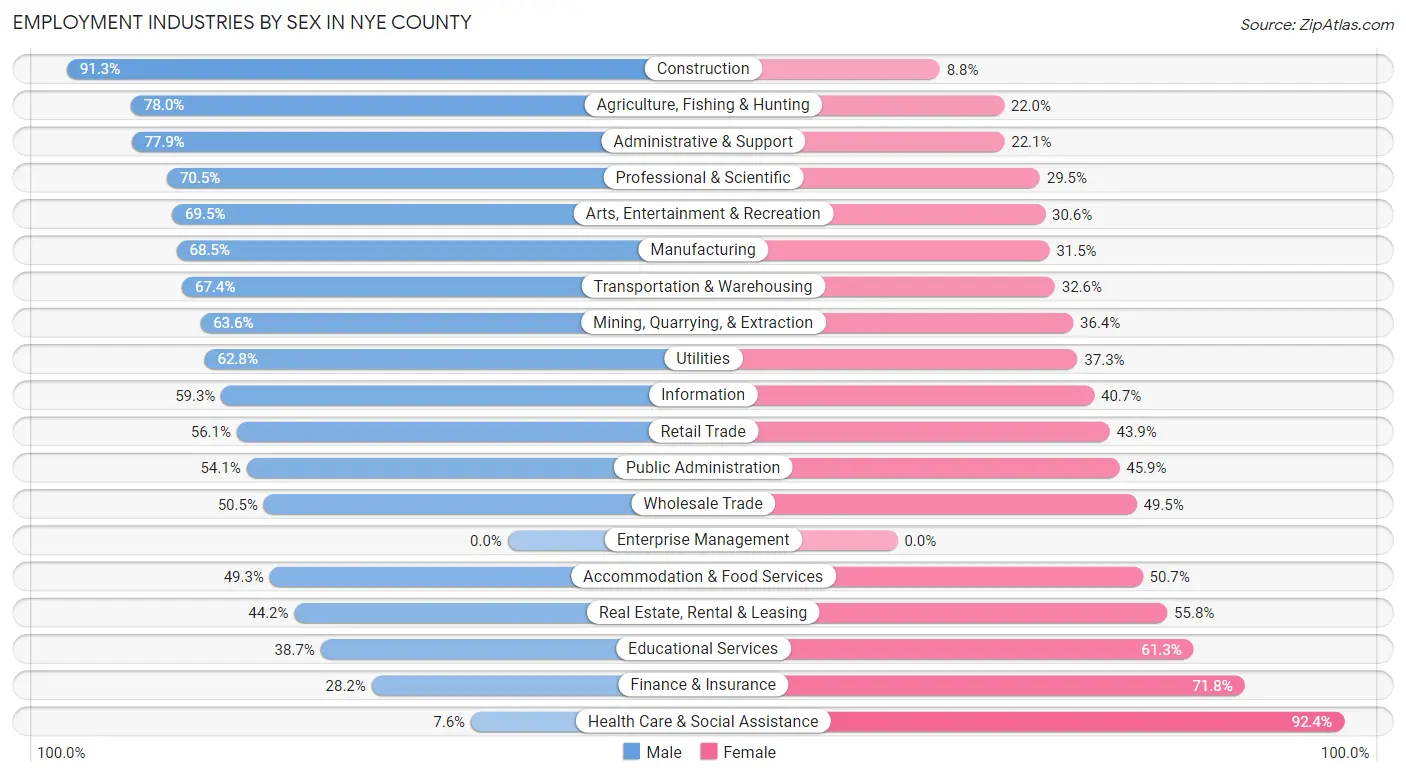
Employment Industries by Sex in Nye County
The Nye County industries that see more men than women are Construction (91.2%), Agriculture, Fishing & Hunting (78.0%), and Administrative & Support (77.9%), whereas the industries that tend to have a higher number of women are Health Care & Social Assistance (92.4%), Finance & Insurance (71.8%), and Educational Services (61.3%).
| Industry | Male | Female |
| Agriculture, Fishing & Hunting | 170 (78.0%) | 48 (22.0%) |
| Mining, Quarrying, & Extraction | 826 (63.6%) | 472 (36.4%) |
| Construction | 1,480 (91.2%) | 142 (8.7%) |
| Manufacturing | 710 (68.5%) | 326 (31.5%) |
| Wholesale Trade | 202 (50.5%) | 198 (49.5%) |
| Retail Trade | 1,209 (56.1%) | 947 (43.9%) |
| Transportation & Warehousing | 577 (67.4%) | 279 (32.6%) |
| Utilities | 128 (62.7%) | 76 (37.2%) |
| Information | 137 (59.3%) | 94 (40.7%) |
| Finance & Insurance | 71 (28.2%) | 181 (71.8%) |
| Real Estate, Rental & Leasing | 106 (44.2%) | 134 (55.8%) |
| Professional & Scientific | 560 (70.5%) | 234 (29.5%) |
| Enterprise Management | 0 (0.0%) | 0 (0.0%) |
| Administrative & Support | 873 (77.9%) | 248 (22.1%) |
| Educational Services | 527 (38.7%) | 834 (61.3%) |
| Health Care & Social Assistance | 78 (7.6%) | 947 (92.4%) |
| Arts, Entertainment & Recreation | 948 (69.5%) | 417 (30.5%) |
| Accommodation & Food Services | 574 (49.3%) | 591 (50.7%) |
| Public Administration | 538 (54.1%) | 457 (45.9%) |
| Total | 9,951 (59.3%) | 6,824 (40.7%) |
Education in Nye County
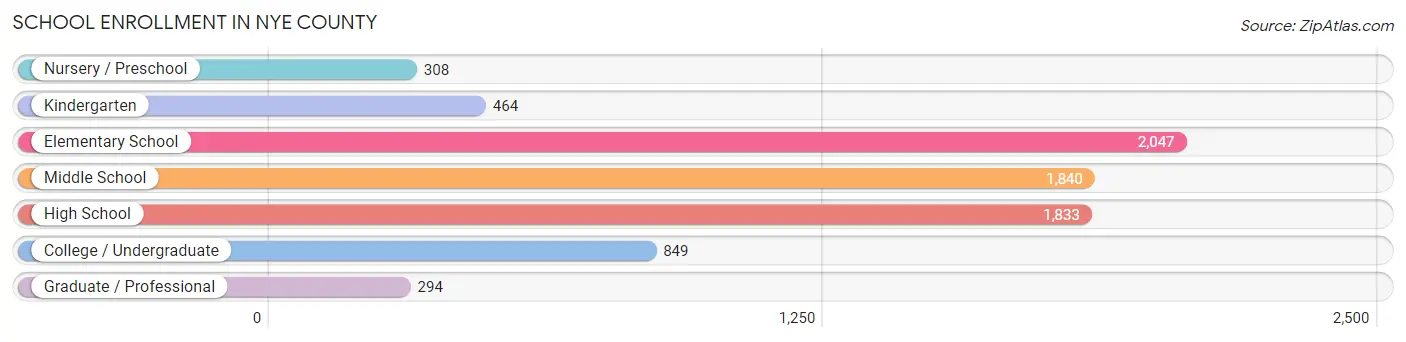
School Enrollment in Nye County
The most common levels of schooling among the 7,635 students in Nye County are elementary school (2,047 | 26.8%), middle school (1,840 | 24.1%), and high school (1,833 | 24.0%).
| School Level | # Students | % Students |
| Nursery / Preschool | 308 | 4.0% |
| Kindergarten | 464 | 6.1% |
| Elementary School | 2,047 | 26.8% |
| Middle School | 1,840 | 24.1% |
| High School | 1,833 | 24.0% |
| College / Undergraduate | 849 | 11.1% |
| Graduate / Professional | 294 | 3.8% |
| Total | 7,635 | 100.0% |
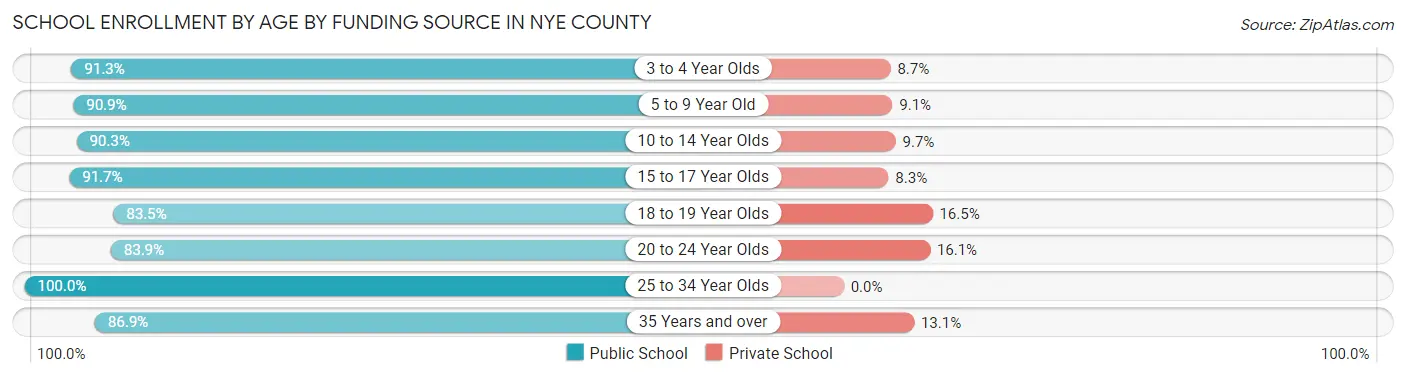
School Enrollment by Age by Funding Source in Nye County
Out of a total of 7,635 students who are enrolled in schools in Nye County, 718 (9.4%) attend a private institution, while the remaining 6,917 (90.6%) are enrolled in public schools. The age group of 18 to 19 year olds has the highest likelihood of being enrolled in private schools, with 44 (16.5% in the age bracket) enrolled. Conversely, the age group of 25 to 34 year olds has the lowest likelihood of being enrolled in a private school, with 415 (100.0% in the age bracket) attending a public institution.
| Age Bracket | Public School | Private School |
| 3 to 4 Year Olds | 293 (91.3%) | 28 (8.7%) |
| 5 to 9 Year Old | 2,216 (90.9%) | 221 (9.1%) |
| 10 to 14 Year Olds | 1,821 (90.3%) | 195 (9.7%) |
| 15 to 17 Year Olds | 1,331 (91.7%) | 121 (8.3%) |
| 18 to 19 Year Olds | 222 (83.5%) | 44 (16.5%) |
| 20 to 24 Year Olds | 329 (83.9%) | 63 (16.1%) |
| 25 to 34 Year Olds | 415 (100.0%) | 0 (0.0%) |
| 35 Years and over | 292 (86.9%) | 44 (13.1%) |
| Total | 6,917 (90.6%) | 718 (9.4%) |
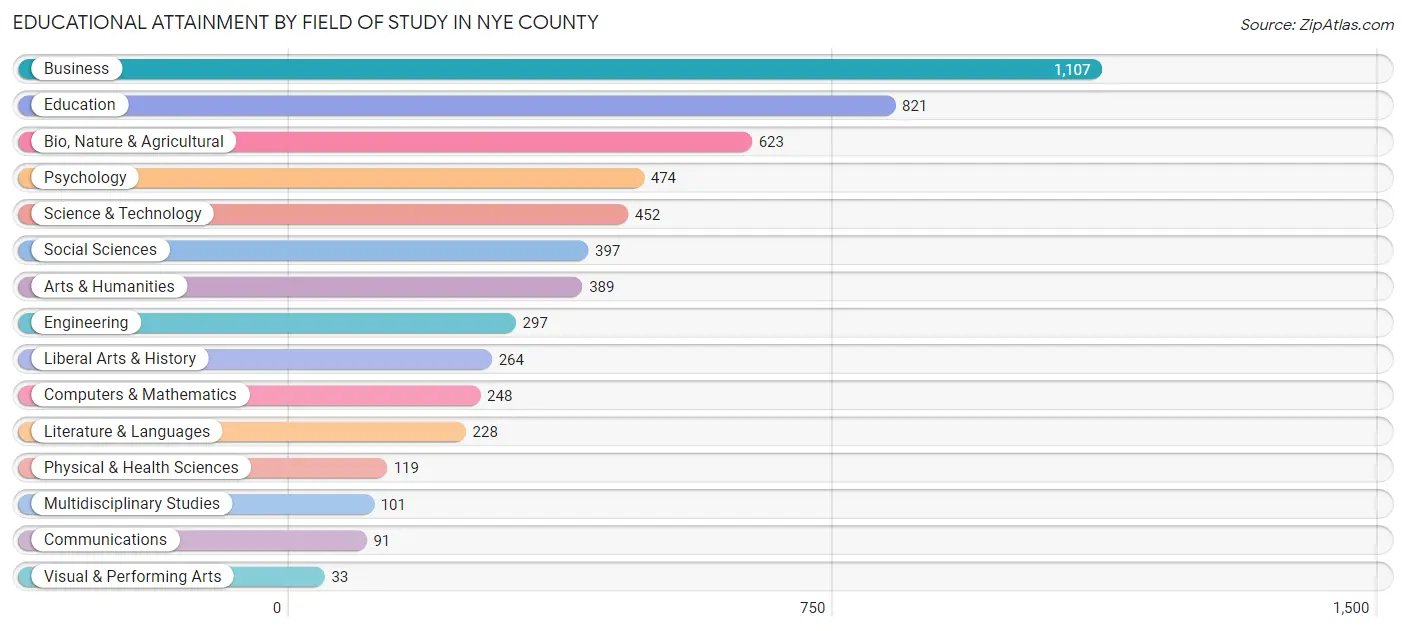
Educational Attainment by Field of Study in Nye County
Business (1,107 | 19.6%), education (821 | 14.5%), bio, nature & agricultural (623 | 11.0%), psychology (474 | 8.4%), and science & technology (452 | 8.0%) are the most common fields of study among 5,644 individuals in Nye County who have obtained a bachelor's degree or higher.
| Field of Study | # Graduates | % Graduates |
| Computers & Mathematics | 248 | 4.4% |
| Bio, Nature & Agricultural | 623 | 11.0% |
| Physical & Health Sciences | 119 | 2.1% |
| Psychology | 474 | 8.4% |
| Social Sciences | 397 | 7.0% |
| Engineering | 297 | 5.3% |
| Multidisciplinary Studies | 101 | 1.8% |
| Science & Technology | 452 | 8.0% |
| Business | 1,107 | 19.6% |
| Education | 821 | 14.5% |
| Literature & Languages | 228 | 4.0% |
| Liberal Arts & History | 264 | 4.7% |
| Visual & Performing Arts | 33 | 0.6% |
| Communications | 91 | 1.6% |
| Arts & Humanities | 389 | 6.9% |
| Total | 5,644 | 100.0% |
Transportation & Commute in Nye County
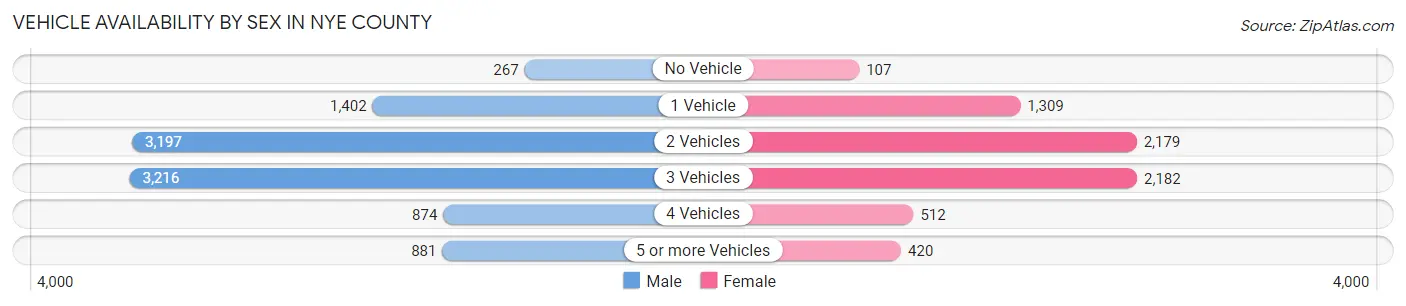
Vehicle Availability by Sex in Nye County
The most prevalent vehicle ownership categories in Nye County are males with 3 vehicles (3,216, accounting for 32.7%) and females with 3 vehicles (2,182, making up 47.9%).
| Vehicles Available | Male | Female |
| No Vehicle | 267 (2.7%) | 107 (1.6%) |
| 1 Vehicle | 1,402 (14.2%) | 1,309 (19.5%) |
| 2 Vehicles | 3,197 (32.5%) | 2,179 (32.5%) |
| 3 Vehicles | 3,216 (32.7%) | 2,182 (32.5%) |
| 4 Vehicles | 874 (8.9%) | 512 (7.6%) |
| 5 or more Vehicles | 881 (9.0%) | 420 (6.3%) |
| Total | 9,837 (100.0%) | 6,709 (100.0%) |
Commute Time in Nye County
The most frequently occuring commute durations in Nye County are 10 to 14 minutes (3,918 commuters, 25.7%), 5 to 9 minutes (2,530 commuters, 16.6%), and 60 to 89 minutes (2,479 commuters, 16.3%).
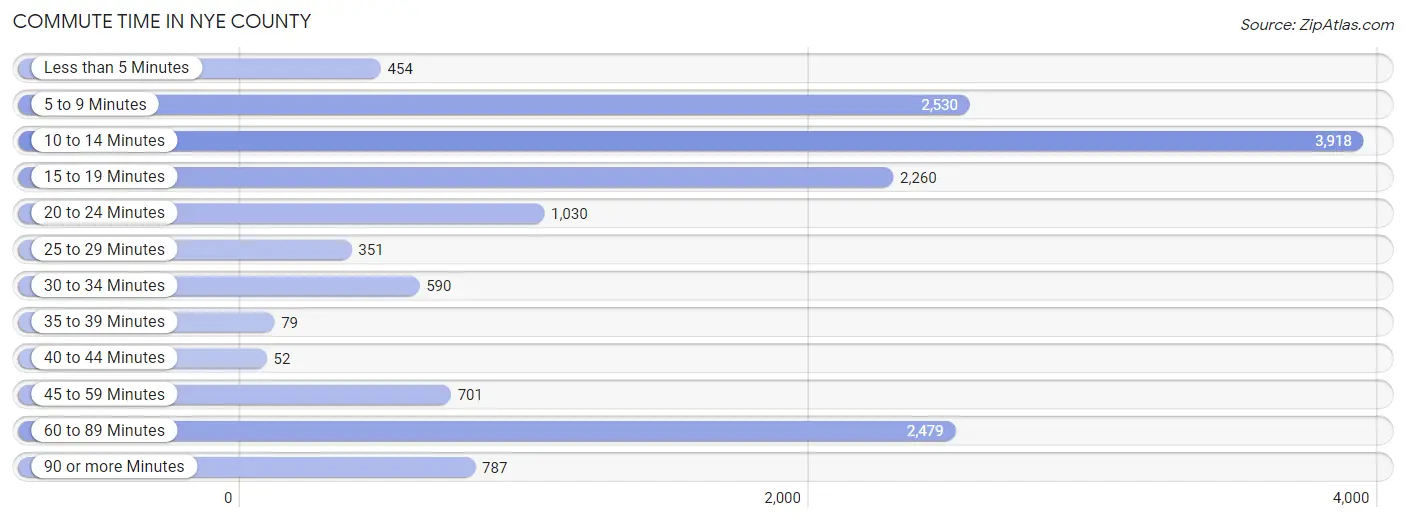
| Commute Time | # Commuters | % Commuters |
| Less than 5 Minutes | 454 | 3.0% |
| 5 to 9 Minutes | 2,530 | 16.6% |
| 10 to 14 Minutes | 3,918 | 25.7% |
| 15 to 19 Minutes | 2,260 | 14.8% |
| 20 to 24 Minutes | 1,030 | 6.8% |
| 25 to 29 Minutes | 351 | 2.3% |
| 30 to 34 Minutes | 590 | 3.9% |
| 35 to 39 Minutes | 79 | 0.5% |
| 40 to 44 Minutes | 52 | 0.3% |
| 45 to 59 Minutes | 701 | 4.6% |
| 60 to 89 Minutes | 2,479 | 16.3% |
| 90 or more Minutes | 787 | 5.2% |
Commute Time by Sex in Nye County
The most common commute times in Nye County are 10 to 14 minutes (2,163 commuters, 23.9%) for males and 10 to 14 minutes (1,755 commuters, 28.4%) for females.
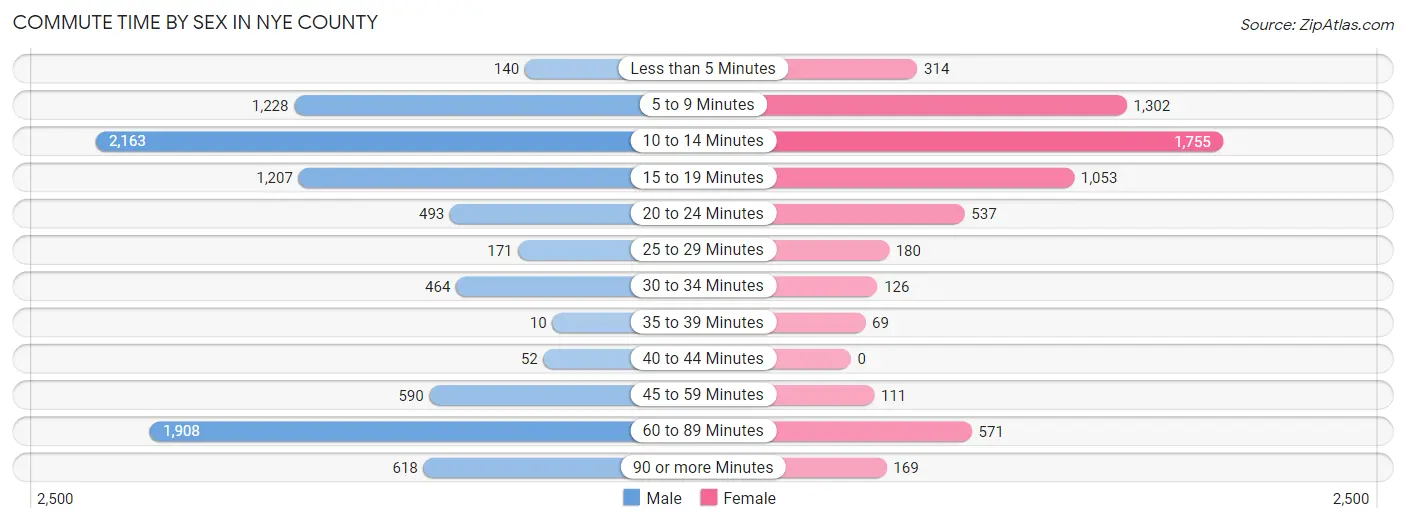
| Commute Time | Male | Female |
| Less than 5 Minutes | 140 (1.5%) | 314 (5.1%) |
| 5 to 9 Minutes | 1,228 (13.6%) | 1,302 (21.0%) |
| 10 to 14 Minutes | 2,163 (23.9%) | 1,755 (28.4%) |
| 15 to 19 Minutes | 1,207 (13.4%) | 1,053 (17.0%) |
| 20 to 24 Minutes | 493 (5.4%) | 537 (8.7%) |
| 25 to 29 Minutes | 171 (1.9%) | 180 (2.9%) |
| 30 to 34 Minutes | 464 (5.1%) | 126 (2.0%) |
| 35 to 39 Minutes | 10 (0.1%) | 69 (1.1%) |
| 40 to 44 Minutes | 52 (0.6%) | 0 (0.0%) |
| 45 to 59 Minutes | 590 (6.5%) | 111 (1.8%) |
| 60 to 89 Minutes | 1,908 (21.1%) | 571 (9.2%) |
| 90 or more Minutes | 618 (6.8%) | 169 (2.7%) |
Time of Departure to Work by Sex in Nye County
The most frequent times of departure to work in Nye County are 12:00 AM to 4:59 AM (1,711, 18.9%) for males and 7:30 AM to 7:59 AM (832, 13.5%) for females.
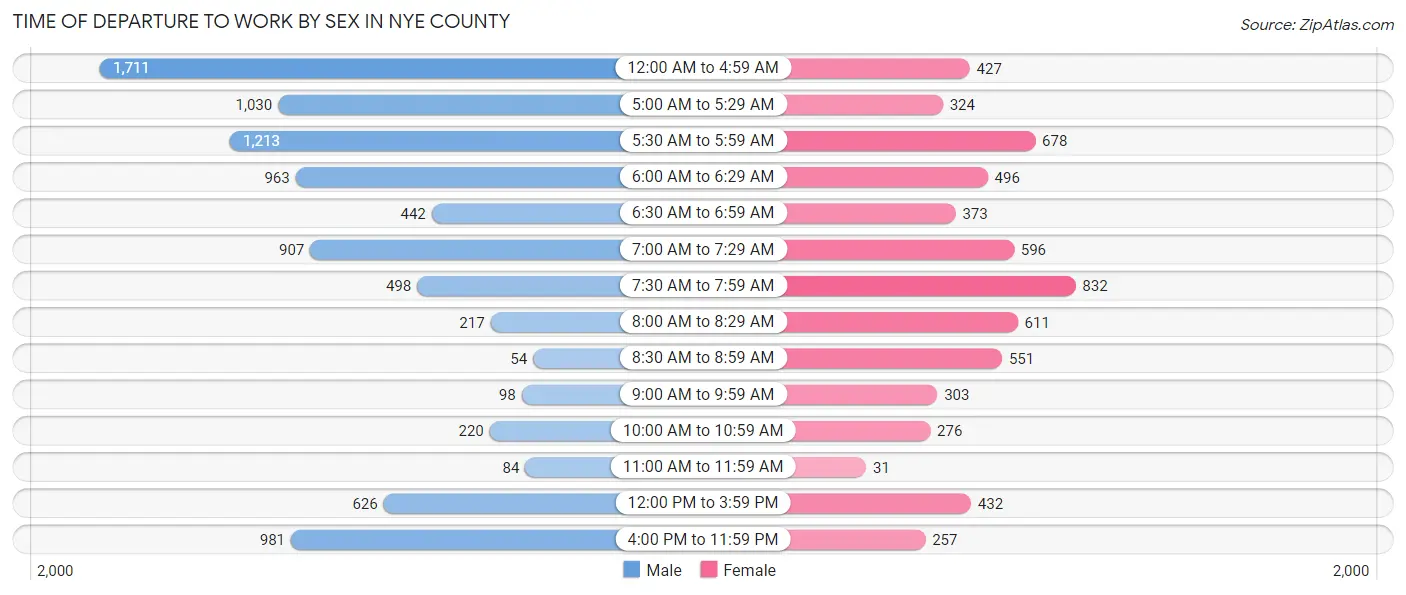
| Time of Departure | Male | Female |
| 12:00 AM to 4:59 AM | 1,711 (18.9%) | 427 (6.9%) |
| 5:00 AM to 5:29 AM | 1,030 (11.4%) | 324 (5.2%) |
| 5:30 AM to 5:59 AM | 1,213 (13.4%) | 678 (11.0%) |
| 6:00 AM to 6:29 AM | 963 (10.6%) | 496 (8.0%) |
| 6:30 AM to 6:59 AM | 442 (4.9%) | 373 (6.0%) |
| 7:00 AM to 7:29 AM | 907 (10.0%) | 596 (9.6%) |
| 7:30 AM to 7:59 AM | 498 (5.5%) | 832 (13.5%) |
| 8:00 AM to 8:29 AM | 217 (2.4%) | 611 (9.9%) |
| 8:30 AM to 8:59 AM | 54 (0.6%) | 551 (8.9%) |
| 9:00 AM to 9:59 AM | 98 (1.1%) | 303 (4.9%) |
| 10:00 AM to 10:59 AM | 220 (2.4%) | 276 (4.5%) |
| 11:00 AM to 11:59 AM | 84 (0.9%) | 31 (0.5%) |
| 12:00 PM to 3:59 PM | 626 (6.9%) | 432 (7.0%) |
| 4:00 PM to 11:59 PM | 981 (10.8%) | 257 (4.2%) |
| Total | 9,044 (100.0%) | 6,187 (100.0%) |
Housing Occupancy in Nye County
Occupancy by Ownership in Nye County
Of the total 21,847 dwellings in Nye County, owner-occupied units account for 16,407 (75.1%), while renter-occupied units make up 5,440 (24.9%).
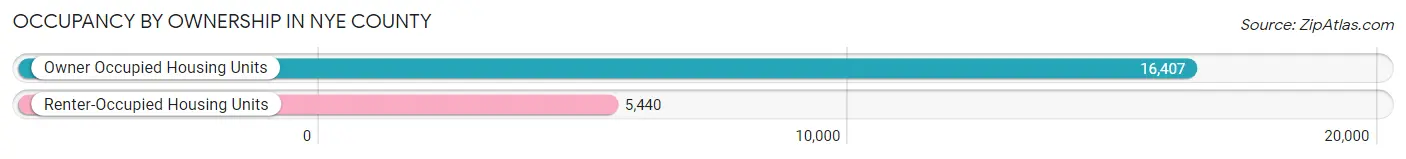
| Occupancy | # Housing Units | % Housing Units |
| Owner Occupied Housing Units | 16,407 | 75.1% |
| Renter-Occupied Housing Units | 5,440 | 24.9% |
| Total Occupied Housing Units | 21,847 | 100.0% |
Occupancy by Household Size in Nye County
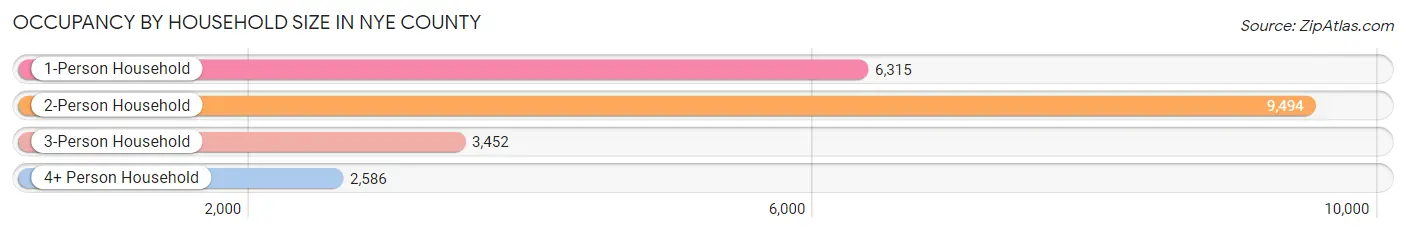
| Household Size | # Housing Units | % Housing Units |
| 1-Person Household | 6,315 | 28.9% |
| 2-Person Household | 9,494 | 43.5% |
| 3-Person Household | 3,452 | 15.8% |
| 4+ Person Household | 2,586 | 11.8% |
| Total Housing Units | 21,847 | 100.0% |
Occupancy by Ownership by Household Size in Nye County
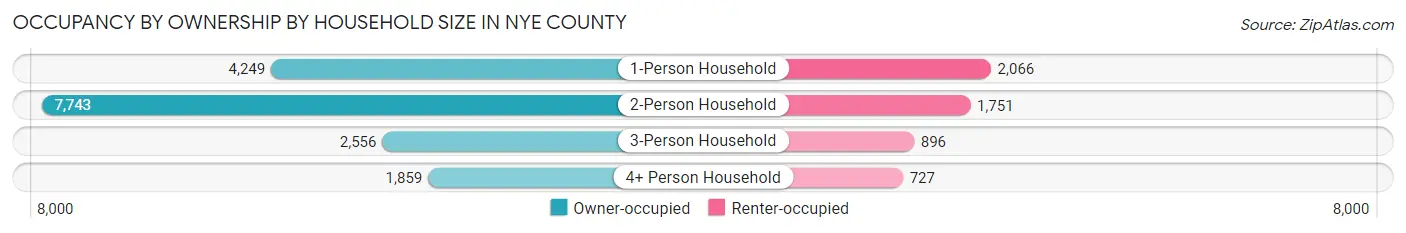
| Household Size | Owner-occupied | Renter-occupied |
| 1-Person Household | 4,249 (67.3%) | 2,066 (32.7%) |
| 2-Person Household | 7,743 (81.6%) | 1,751 (18.4%) |
| 3-Person Household | 2,556 (74.0%) | 896 (26.0%) |
| 4+ Person Household | 1,859 (71.9%) | 727 (28.1%) |
| Total Housing Units | 16,407 (75.1%) | 5,440 (24.9%) |
Occupancy by Educational Attainment in Nye County
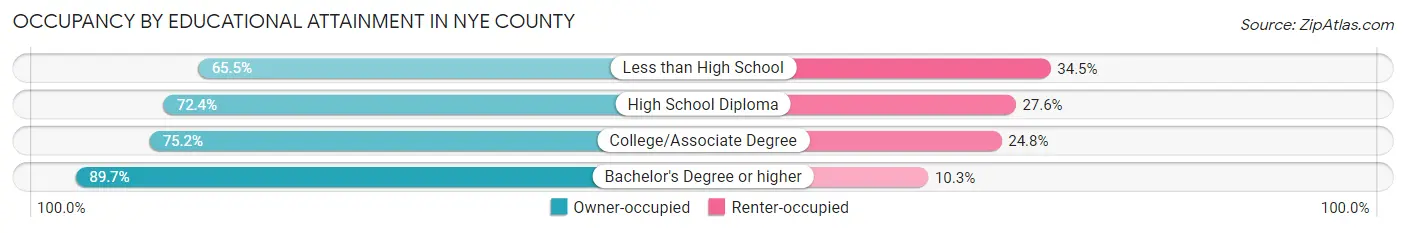
| Household Size | Owner-occupied | Renter-occupied |
| Less than High School | 1,657 (65.5%) | 874 (34.5%) |
| High School Diploma | 4,903 (72.4%) | 1,870 (27.6%) |
| College/Associate Degree | 7,278 (75.2%) | 2,402 (24.8%) |
| Bachelor's Degree or higher | 2,569 (89.7%) | 294 (10.3%) |
Occupancy by Age of Householder in Nye County
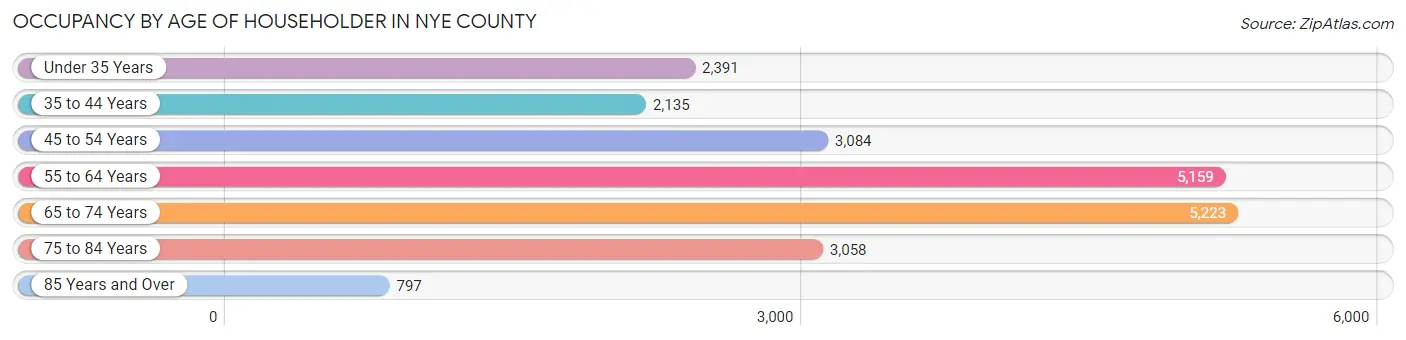
| Age Bracket | # Households | % Households |
| Under 35 Years | 2,391 | 10.9% |
| 35 to 44 Years | 2,135 | 9.8% |
| 45 to 54 Years | 3,084 | 14.1% |
| 55 to 64 Years | 5,159 | 23.6% |
| 65 to 74 Years | 5,223 | 23.9% |
| 75 to 84 Years | 3,058 | 14.0% |
| 85 Years and Over | 797 | 3.6% |
| Total | 21,847 | 100.0% |
Housing Finances in Nye County
Median Income by Occupancy in Nye County
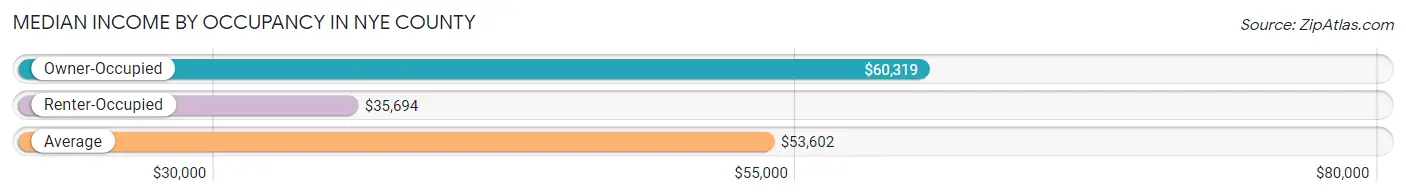
| Occupancy Type | # Households | Median Income |
| Owner-Occupied | 16,407 (75.1%) | $60,319 |
| Renter-Occupied | 5,440 (24.9%) | $35,694 |
| Average | 21,847 (100.0%) | $53,602 |
Occupancy by Householder Income Bracket in Nye County
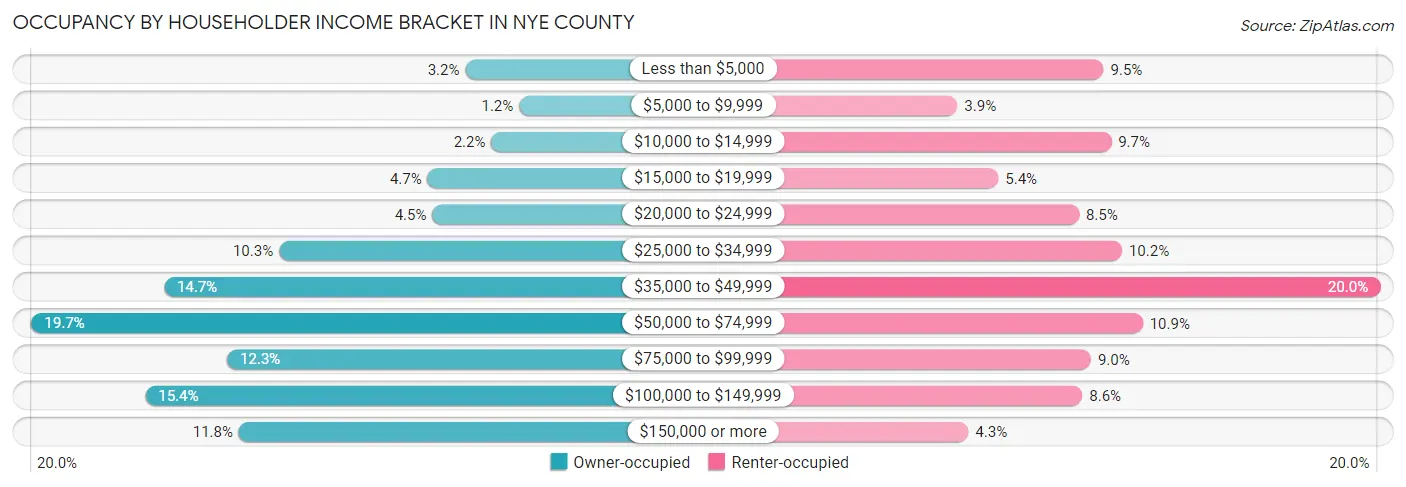
| Income Bracket | Owner-occupied | Renter-occupied |
| Less than $5,000 | 527 (3.2%) | 514 (9.5%) |
| $5,000 to $9,999 | 191 (1.2%) | 211 (3.9%) |
| $10,000 to $14,999 | 365 (2.2%) | 530 (9.7%) |
| $15,000 to $19,999 | 763 (4.6%) | 296 (5.4%) |
| $20,000 to $24,999 | 734 (4.5%) | 463 (8.5%) |
| $25,000 to $34,999 | 1,692 (10.3%) | 552 (10.2%) |
| $35,000 to $49,999 | 2,411 (14.7%) | 1,087 (20.0%) |
| $50,000 to $74,999 | 3,239 (19.7%) | 595 (10.9%) |
| $75,000 to $99,999 | 2,016 (12.3%) | 488 (9.0%) |
| $100,000 to $149,999 | 2,526 (15.4%) | 470 (8.6%) |
| $150,000 or more | 1,943 (11.8%) | 234 (4.3%) |
| Total | 16,407 (100.0%) | 5,440 (100.0%) |
Monthly Housing Cost Tiers in Nye County
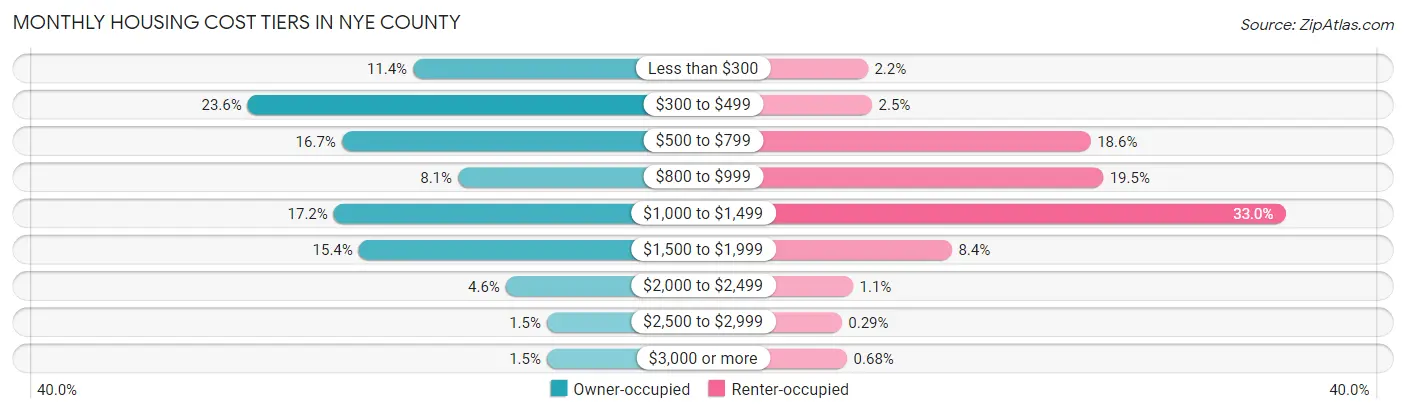
| Monthly Cost | Owner-occupied | Renter-occupied |
| Less than $300 | 1,870 (11.4%) | 120 (2.2%) |
| $300 to $499 | 3,868 (23.6%) | 137 (2.5%) |
| $500 to $799 | 2,732 (16.7%) | 1,013 (18.6%) |
| $800 to $999 | 1,327 (8.1%) | 1,063 (19.5%) |
| $1,000 to $1,499 | 2,829 (17.2%) | 1,794 (33.0%) |
| $1,500 to $1,999 | 2,526 (15.4%) | 457 (8.4%) |
| $2,000 to $2,499 | 750 (4.6%) | 61 (1.1%) |
| $2,500 to $2,999 | 252 (1.5%) | 16 (0.3%) |
| $3,000 or more | 253 (1.5%) | 37 (0.7%) |
| Total | 16,407 (100.0%) | 5,440 (100.0%) |
Physical Housing Characteristics in Nye County
Housing Structures in Nye County
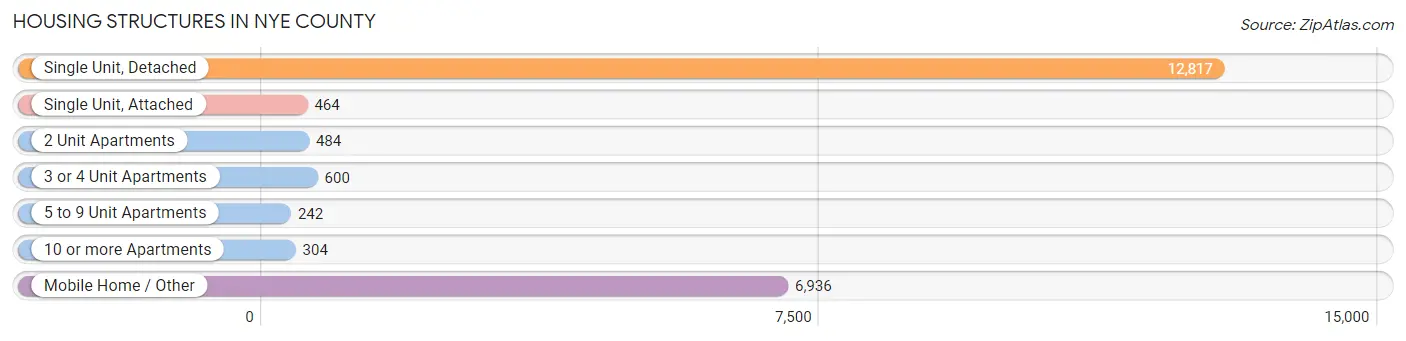
| Structure Type | # Housing Units | % Housing Units |
| Single Unit, Detached | 12,817 | 58.7% |
| Single Unit, Attached | 464 | 2.1% |
| 2 Unit Apartments | 484 | 2.2% |
| 3 or 4 Unit Apartments | 600 | 2.8% |
| 5 to 9 Unit Apartments | 242 | 1.1% |
| 10 or more Apartments | 304 | 1.4% |
| Mobile Home / Other | 6,936 | 31.8% |
| Total | 21,847 | 100.0% |
Housing Structures by Occupancy in Nye County
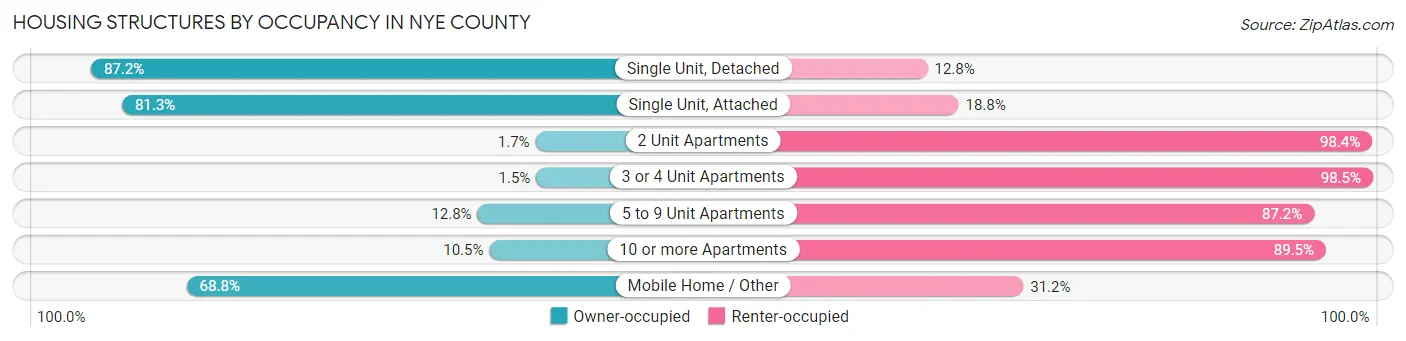
| Structure Type | Owner-occupied | Renter-occupied |
| Single Unit, Detached | 11,179 (87.2%) | 1,638 (12.8%) |
| Single Unit, Attached | 377 (81.2%) | 87 (18.8%) |
| 2 Unit Apartments | 8 (1.7%) | 476 (98.4%) |
| 3 or 4 Unit Apartments | 9 (1.5%) | 591 (98.5%) |
| 5 to 9 Unit Apartments | 31 (12.8%) | 211 (87.2%) |
| 10 or more Apartments | 32 (10.5%) | 272 (89.5%) |
| Mobile Home / Other | 4,771 (68.8%) | 2,165 (31.2%) |
| Total | 16,407 (75.1%) | 5,440 (24.9%) |
Housing Structures by Number of Rooms in Nye County
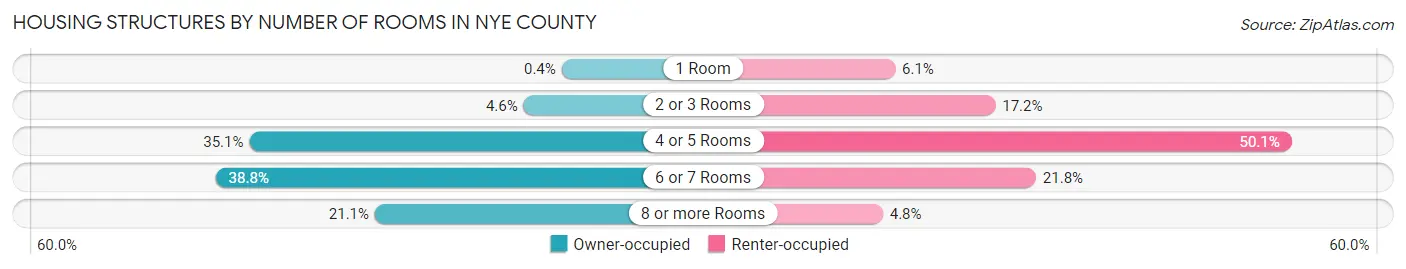
| Number of Rooms | Owner-occupied | Renter-occupied |
| 1 Room | 65 (0.4%) | 333 (6.1%) |
| 2 or 3 Rooms | 759 (4.6%) | 938 (17.2%) |
| 4 or 5 Rooms | 5,753 (35.1%) | 2,727 (50.1%) |
| 6 or 7 Rooms | 6,364 (38.8%) | 1,183 (21.7%) |
| 8 or more Rooms | 3,466 (21.1%) | 259 (4.8%) |
| Total | 16,407 (100.0%) | 5,440 (100.0%) |
Housing Structure by Heating Type in Nye County
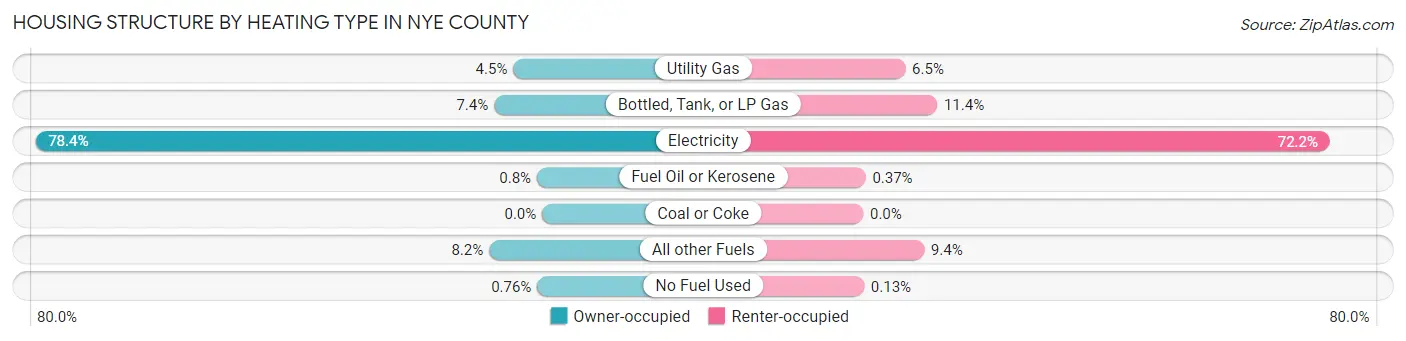
| Heating Type | Owner-occupied | Renter-occupied |
| Utility Gas | 732 (4.5%) | 354 (6.5%) |
| Bottled, Tank, or LP Gas | 1,219 (7.4%) | 622 (11.4%) |
| Electricity | 12,855 (78.3%) | 3,925 (72.2%) |
| Fuel Oil or Kerosene | 131 (0.8%) | 20 (0.4%) |
| Coal or Coke | 0 (0.0%) | 0 (0.0%) |
| All other Fuels | 1,345 (8.2%) | 512 (9.4%) |
| No Fuel Used | 125 (0.8%) | 7 (0.1%) |
| Total | 16,407 (100.0%) | 5,440 (100.0%) |
Household Vehicle Usage in Nye County
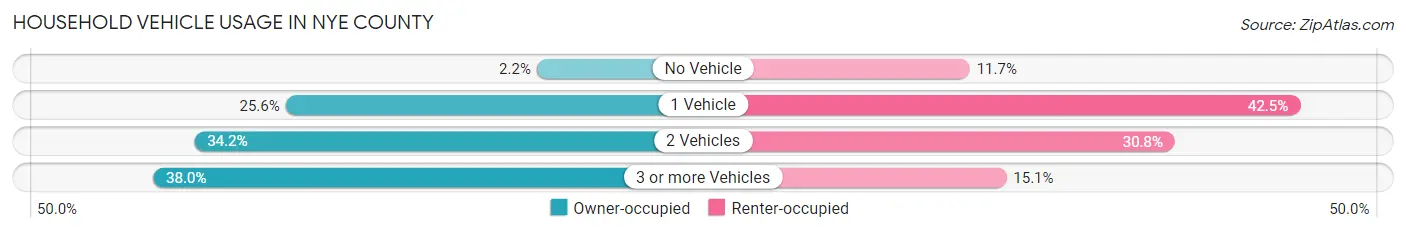
| Vehicles per Household | Owner-occupied | Renter-occupied |
| No Vehicle | 360 (2.2%) | 634 (11.7%) |
| 1 Vehicle | 4,207 (25.6%) | 2,311 (42.5%) |
| 2 Vehicles | 5,605 (34.2%) | 1,675 (30.8%) |
| 3 or more Vehicles | 6,235 (38.0%) | 820 (15.1%) |
| Total | 16,407 (100.0%) | 5,440 (100.0%) |
Real Estate & Mortgages in Nye County
Real Estate and Mortgage Overview in Nye County
| Characteristic | Without Mortgage | With Mortgage |
| Housing Units | 8,122 | 8,285 |
| Median Property Value | $199,900 | $262,300 |
| Median Household Income | $49,821 | $1,463 |
| Monthly Housing Costs | $397 | $223 |
| Real Estate Taxes | $1,081 | $224 |
Property Value by Mortgage Status in Nye County
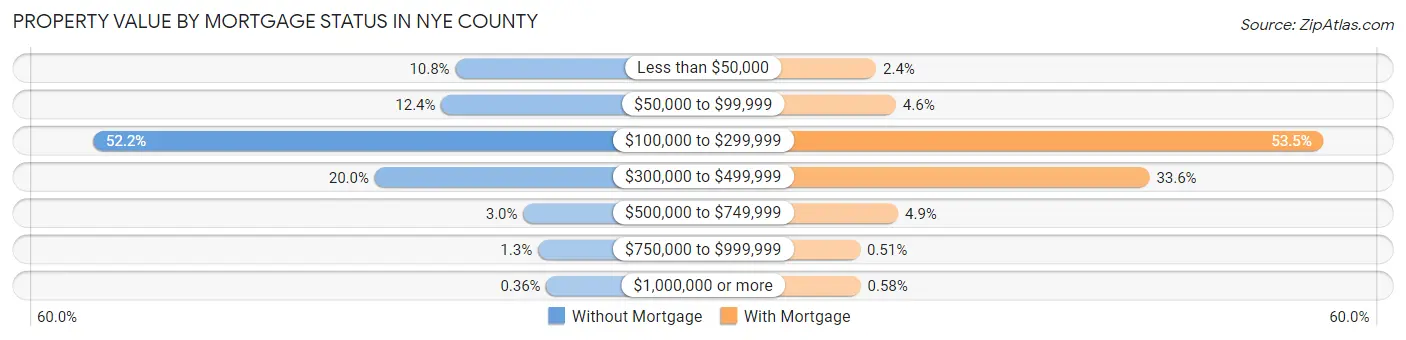
| Property Value | Without Mortgage | With Mortgage |
| Less than $50,000 | 874 (10.8%) | 195 (2.4%) |
| $50,000 to $99,999 | 1,005 (12.4%) | 382 (4.6%) |
| $100,000 to $299,999 | 4,239 (52.2%) | 4,432 (53.5%) |
| $300,000 to $499,999 | 1,623 (20.0%) | 2,783 (33.6%) |
| $500,000 to $749,999 | 244 (3.0%) | 403 (4.9%) |
| $750,000 to $999,999 | 108 (1.3%) | 42 (0.5%) |
| $1,000,000 or more | 29 (0.4%) | 48 (0.6%) |
| Total | 8,122 (100.0%) | 8,285 (100.0%) |
Household Income by Mortgage Status in Nye County
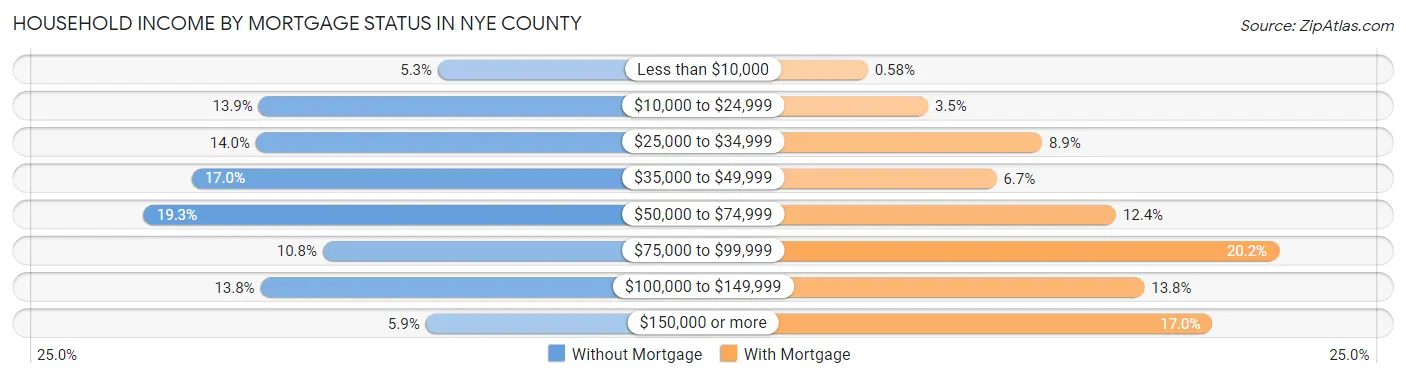
| Household Income | Without Mortgage | With Mortgage |
| Less than $10,000 | 432 (5.3%) | 48 (0.6%) |
| $10,000 to $24,999 | 1,126 (13.9%) | 286 (3.5%) |
| $25,000 to $34,999 | 1,136 (14.0%) | 736 (8.9%) |
| $35,000 to $49,999 | 1,384 (17.0%) | 556 (6.7%) |
| $50,000 to $74,999 | 1,569 (19.3%) | 1,027 (12.4%) |
| $75,000 to $99,999 | 877 (10.8%) | 1,670 (20.2%) |
| $100,000 to $149,999 | 1,118 (13.8%) | 1,139 (13.8%) |
| $150,000 or more | 480 (5.9%) | 1,408 (17.0%) |
| Total | 8,122 (100.0%) | 8,285 (100.0%) |
Property Value to Household Income Ratio in Nye County
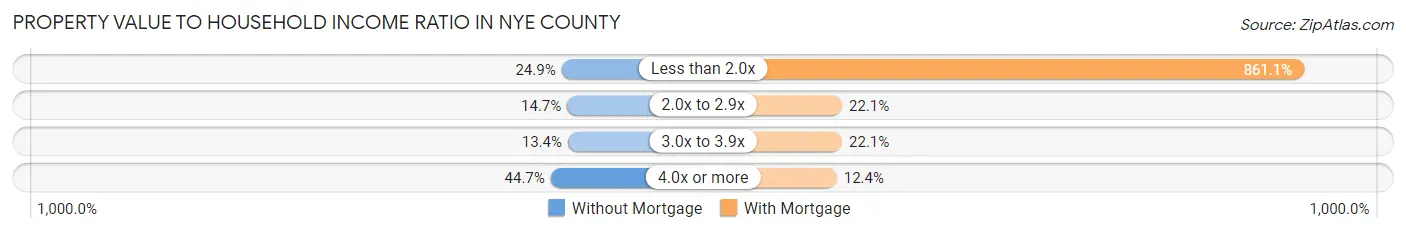
| Value-to-Income Ratio | Without Mortgage | With Mortgage |
| Less than 2.0x | 2,024 (24.9%) | 71,345 (861.1%) |
| 2.0x to 2.9x | 1,197 (14.7%) | 1,828 (22.1%) |
| 3.0x to 3.9x | 1,092 (13.4%) | 1,832 (22.1%) |
| 4.0x or more | 3,634 (44.7%) | 1,029 (12.4%) |
| Total | 8,122 (100.0%) | 8,285 (100.0%) |
Real Estate Taxes by Mortgage Status in Nye County
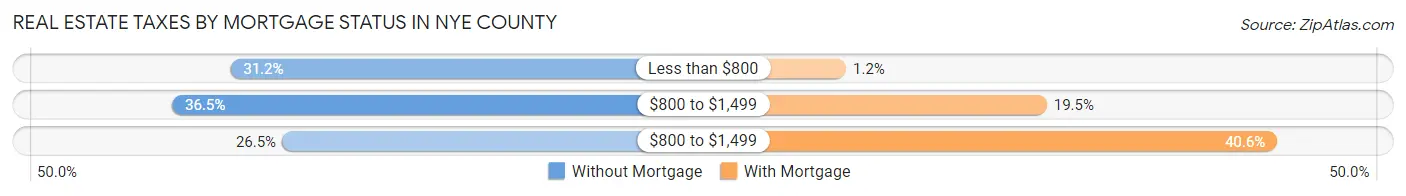
| Property Taxes | Without Mortgage | With Mortgage |
| Less than $800 | 2,535 (31.2%) | 99 (1.2%) |
| $800 to $1,499 | 2,967 (36.5%) | 1,617 (19.5%) |
| $800 to $1,499 | 2,152 (26.5%) | 3,360 (40.6%) |
| Total | 8,122 (100.0%) | 8,285 (100.0%) |
Health & Disability in Nye County
Health Insurance Coverage by Age in Nye County
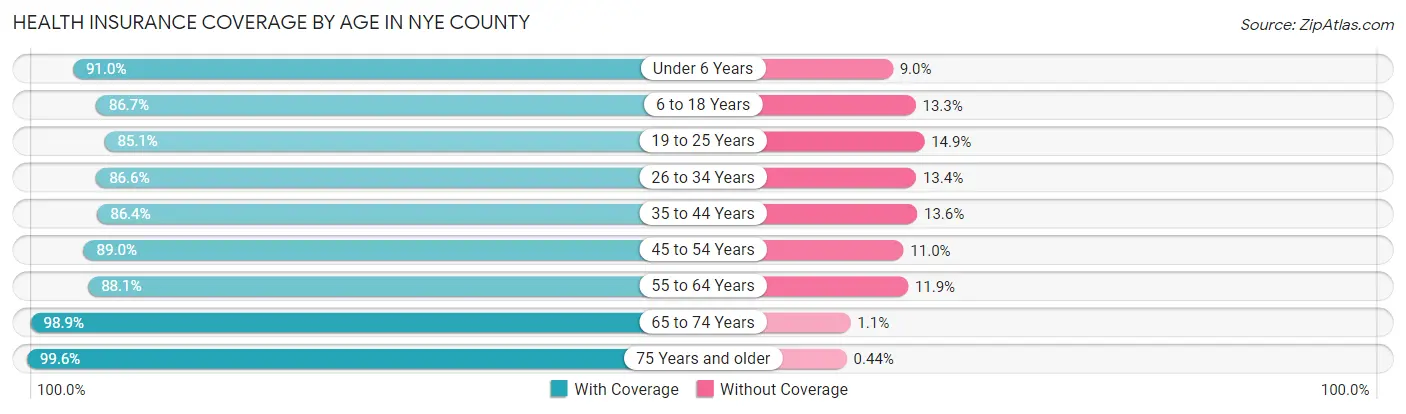
| Age Bracket | With Coverage | Without Coverage |
| Under 6 Years | 2,399 (91.0%) | 238 (9.0%) |
| 6 to 18 Years | 5,448 (86.7%) | 835 (13.3%) |
| 19 to 25 Years | 2,461 (85.1%) | 431 (14.9%) |
| 26 to 34 Years | 3,856 (86.6%) | 595 (13.4%) |
| 35 to 44 Years | 4,021 (86.4%) | 631 (13.6%) |
| 45 to 54 Years | 5,054 (89.0%) | 626 (11.0%) |
| 55 to 64 Years | 7,713 (88.1%) | 1,039 (11.9%) |
| 65 to 74 Years | 9,445 (98.9%) | 109 (1.1%) |
| 75 Years and older | 6,124 (99.6%) | 27 (0.4%) |
| Total | 46,521 (91.1%) | 4,531 (8.9%) |
Health Insurance Coverage by Citizenship Status in Nye County
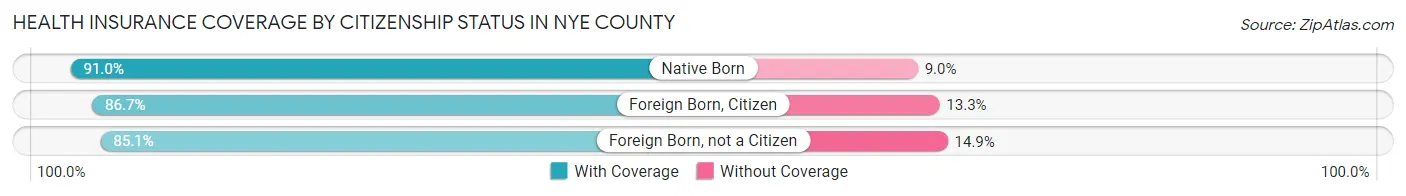
| Citizenship Status | With Coverage | Without Coverage |
| Native Born | 2,399 (91.0%) | 238 (9.0%) |
| Foreign Born, Citizen | 5,448 (86.7%) | 835 (13.3%) |
| Foreign Born, not a Citizen | 2,461 (85.1%) | 431 (14.9%) |
Health Insurance Coverage by Household Income in Nye County
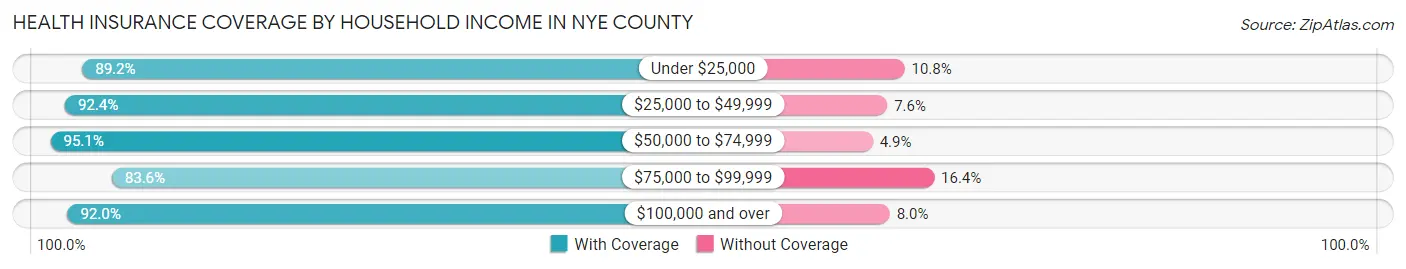
| Household Income | With Coverage | Without Coverage |
| Under $25,000 | 7,027 (89.2%) | 853 (10.8%) |
| $25,000 to $49,999 | 10,700 (92.4%) | 876 (7.6%) |
| $50,000 to $74,999 | 8,642 (95.1%) | 441 (4.9%) |
| $75,000 to $99,999 | 5,530 (83.6%) | 1,082 (16.4%) |
| $100,000 and over | 14,579 (92.0%) | 1,274 (8.0%) |
Public vs Private Health Insurance Coverage by Age in Nye County
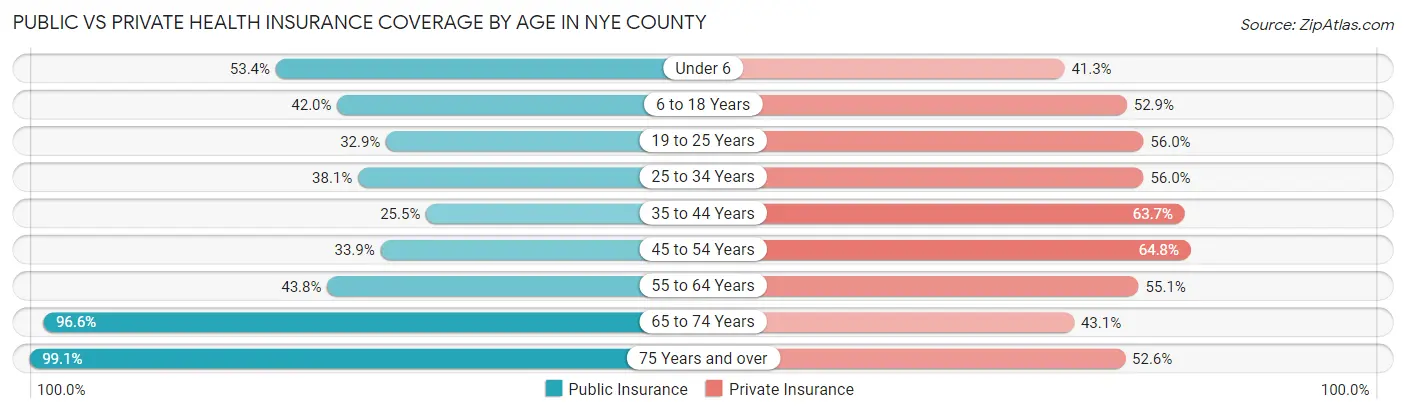
| Age Bracket | Public Insurance | Private Insurance |
| Under 6 | 1,407 (53.4%) | 1,090 (41.3%) |
| 6 to 18 Years | 2,636 (41.9%) | 3,324 (52.9%) |
| 19 to 25 Years | 951 (32.9%) | 1,619 (56.0%) |
| 25 to 34 Years | 1,696 (38.1%) | 2,492 (56.0%) |
| 35 to 44 Years | 1,184 (25.5%) | 2,962 (63.7%) |
| 45 to 54 Years | 1,927 (33.9%) | 3,680 (64.8%) |
| 55 to 64 Years | 3,835 (43.8%) | 4,822 (55.1%) |
| 65 to 74 Years | 9,228 (96.6%) | 4,118 (43.1%) |
| 75 Years and over | 6,098 (99.1%) | 3,235 (52.6%) |
| Total | 28,962 (56.7%) | 27,342 (53.6%) |
Disability Status by Sex by Age in Nye County
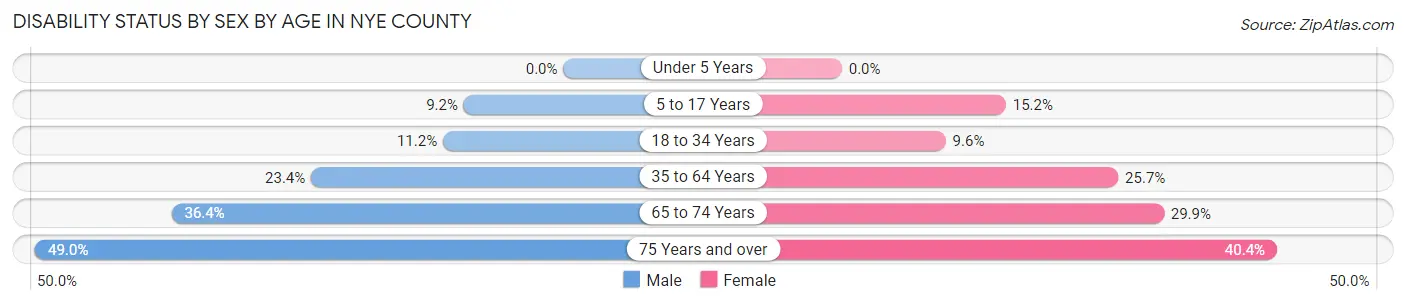
| Age Bracket | Male | Female |
| Under 5 Years | 0 (0.0%) | 0 (0.0%) |
| 5 to 17 Years | 302 (9.2%) | 489 (15.2%) |
| 18 to 34 Years | 461 (11.2%) | 340 (9.6%) |
| 35 to 64 Years | 2,252 (23.4%) | 2,428 (25.7%) |
| 65 to 74 Years | 1,710 (36.4%) | 1,450 (29.9%) |
| 75 Years and over | 1,588 (49.0%) | 1,176 (40.4%) |
Disability Class by Sex by Age in Nye County
Disability Class: Hearing Difficulty
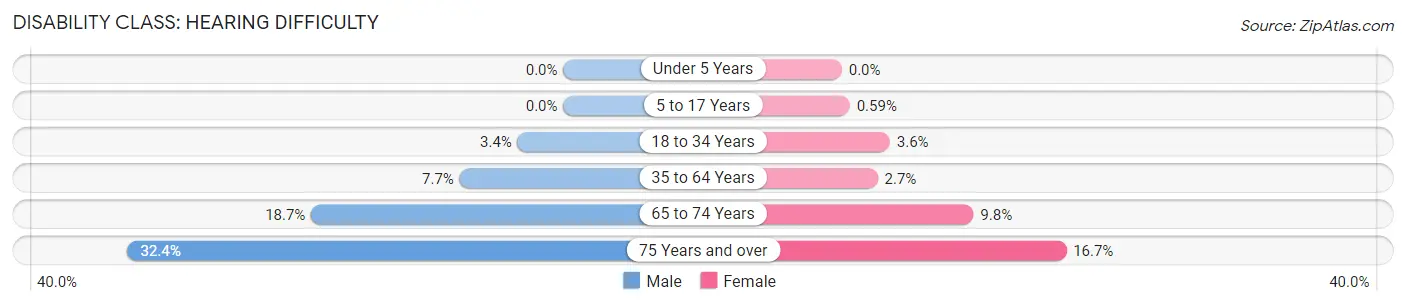
| Age Bracket | Male | Female |
| Under 5 Years | 0 (0.0%) | 0 (0.0%) |
| 5 to 17 Years | 0 (0.0%) | 19 (0.6%) |
| 18 to 34 Years | 140 (3.4%) | 126 (3.6%) |
| 35 to 64 Years | 741 (7.7%) | 252 (2.7%) |
| 65 to 74 Years | 880 (18.7%) | 474 (9.8%) |
| 75 Years and over | 1,048 (32.4%) | 485 (16.7%) |
Disability Class: Vision Difficulty
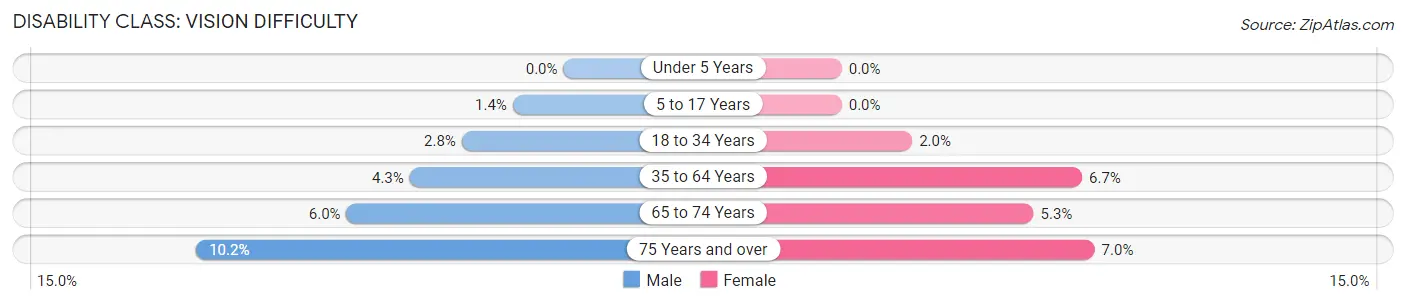
| Age Bracket | Male | Female |
| Under 5 Years | 0 (0.0%) | 0 (0.0%) |
| 5 to 17 Years | 46 (1.4%) | 0 (0.0%) |
| 18 to 34 Years | 117 (2.8%) | 69 (2.0%) |
| 35 to 64 Years | 412 (4.3%) | 633 (6.7%) |
| 65 to 74 Years | 284 (6.0%) | 259 (5.3%) |
| 75 Years and over | 331 (10.2%) | 205 (7.0%) |
Disability Class: Cognitive Difficulty
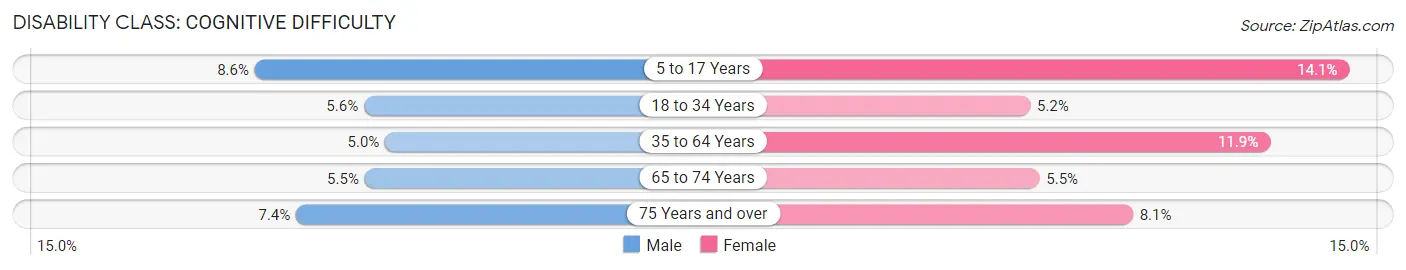
| Age Bracket | Male | Female |
| 5 to 17 Years | 281 (8.6%) | 454 (14.1%) |
| 18 to 34 Years | 229 (5.6%) | 185 (5.2%) |
| 35 to 64 Years | 477 (5.0%) | 1,128 (11.9%) |
| 65 to 74 Years | 260 (5.5%) | 267 (5.5%) |
| 75 Years and over | 241 (7.4%) | 236 (8.1%) |
Disability Class: Ambulatory Difficulty
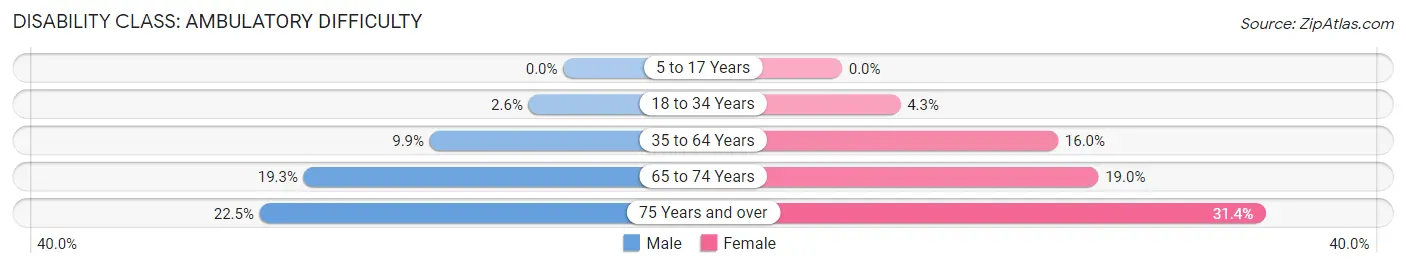
| Age Bracket | Male | Female |
| 5 to 17 Years | 0 (0.0%) | 0 (0.0%) |
| 18 to 34 Years | 106 (2.6%) | 153 (4.3%) |
| 35 to 64 Years | 953 (9.9%) | 1,518 (16.0%) |
| 65 to 74 Years | 906 (19.3%) | 924 (19.0%) |
| 75 Years and over | 730 (22.5%) | 915 (31.4%) |
Disability Class: Self-Care Difficulty
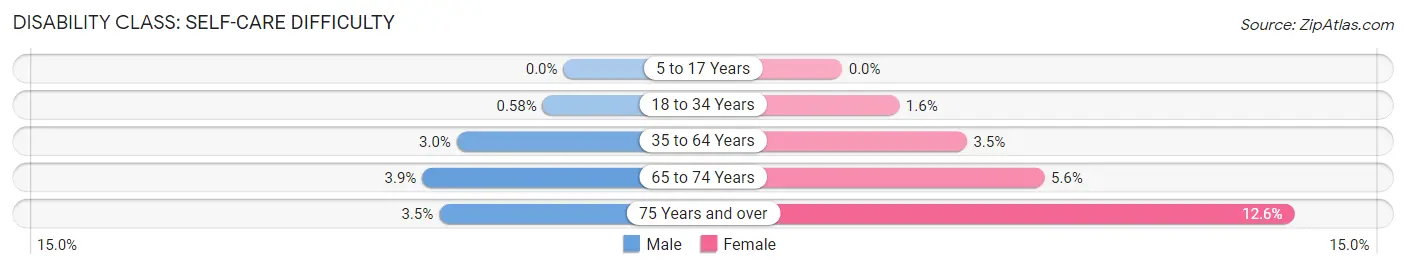
| Age Bracket | Male | Female |
| 5 to 17 Years | 0 (0.0%) | 0 (0.0%) |
| 18 to 34 Years | 24 (0.6%) | 56 (1.6%) |
| 35 to 64 Years | 286 (3.0%) | 328 (3.5%) |
| 65 to 74 Years | 185 (3.9%) | 273 (5.6%) |
| 75 Years and over | 112 (3.5%) | 367 (12.6%) |
Technology Access in Nye County
Computing Device Access in Nye County
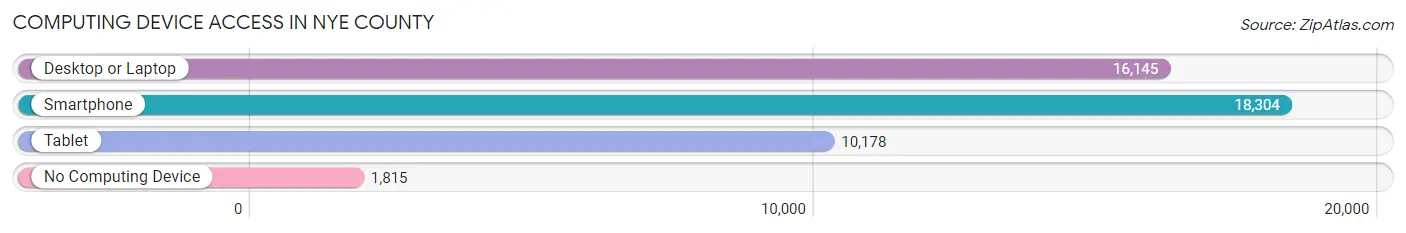
| Device Type | # Households | % Households |
| Desktop or Laptop | 16,145 | 73.9% |
| Smartphone | 18,304 | 83.8% |
| Tablet | 10,178 | 46.6% |
| No Computing Device | 1,815 | 8.3% |
| Total | 21,847 | 100.0% |
Internet Access in Nye County
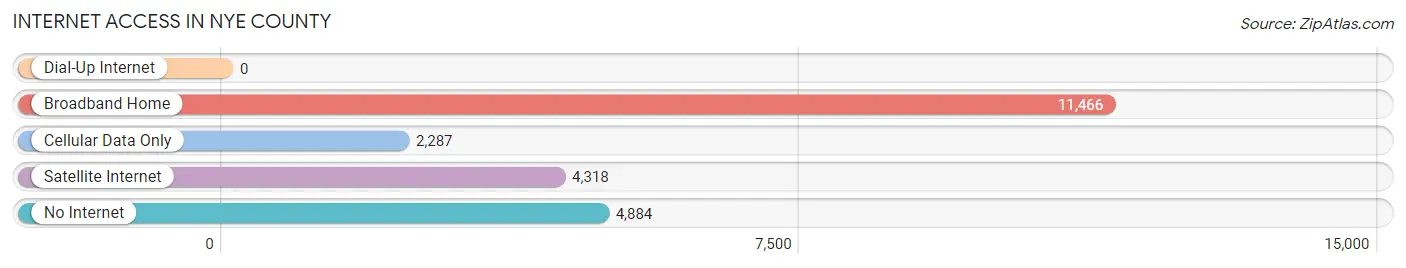
| Internet Type | # Households | % Households |
| Dial-Up Internet | 0 | 0.0% |
| Broadband Home | 11,466 | 52.5% |
| Cellular Data Only | 2,287 | 10.5% |
| Satellite Internet | 4,318 | 19.8% |
| No Internet | 4,884 | 22.4% |
| Total | 21,847 | 100.0% |
Nye County Summary
Nye County is located in the south-central region of Nevada, and is the third largest county in the state. It is bordered by Esmeralda County to the north, Lincoln County to the east, Clark County to the south, and Inyo County, California to the west. The county seat is Tonopah, and the largest city is Pahrump.
History
Nye County was established in 1864, and was named after James W. Nye, the first governor of Nevada. The county was originally part of Esmeralda County, but was split off in 1883. The county was originally populated by Native American tribes, including the Southern Paiute, Shoshone, and Washoe.
In the late 19th century, the county became a popular destination for prospectors, and the area was home to several mining towns, including Tonopah, Rhyolite, and Goldfield. The county was also home to the Tonopah and Tidewater Railroad, which connected the mining towns to the rest of the state.
Geography
Nye County covers an area of 18,181 square miles, making it the third largest county in Nevada. The county is located in the south-central region of the state, and is bordered by Esmeralda County to the north, Lincoln County to the east, Clark County to the south, and Inyo County, California to the west.
The county is mostly composed of desert and semi-arid terrain, with the Amargosa Desert to the west and the Nopah Range to the east. The highest point in the county is the summit of Bald Mountain, which has an elevation of 8,918 feet.
Economy
Nye County’s economy is largely based on mining, tourism, and government services. The county is home to several gold and silver mines, as well as a number of other mineral deposits. Tourism is also a major industry in the county, with visitors coming to explore the area’s natural beauty and visit the many ghost towns.
The county is also home to several military installations, including the Nevada Test and Training Range and the Tonopah Test Range. The county is also home to the Nevada National Security Site, which is used for nuclear testing and research.
Demographics
As of the 2010 census, Nye County had a population of 43,946. The population is largely white (77.3%), with smaller percentages of Hispanic (14.2%), Native American (3.2%), and African American (2.2%) residents. The median household income is $50,945, and the median age is 44.7.
Nye County is home to several small towns, including Tonopah, Pahrump, Beatty, and Amargosa Valley. The county is also home to the Nevada National Security Site, which is used for nuclear testing and research.
Common Questions
What is Per Capita Income in Nye County?
Per Capita income in Nye County is $30,751.
What is the Median Family Income in Nye County?
Median Family Income in Nye County is $64,001.
What is the Median Household income in Nye County?
Median Household Income in Nye County is $53,602.
What is Income or Wage Gap in Nye County?
Income or Wage Gap in Nye County is 25.6%.
Women in Nye County earn 74.4 cents for every dollar earned by a man.
What is Family Income Deficit in Nye County?
Family Income Deficit in Nye County is $9,504.
Families that are below poverty line in Nye County earn $9,504 less on average than the poverty threshold level.
What is Inequality or Gini Index in Nye County?
Inequality or Gini Index in Nye County is 0.44.
What is the Total Population of Nye County?
Total Population of Nye County is 51,698.
What is the Total Male Population of Nye County?
Total Male Population of Nye County is 26,290.
What is the Total Female Population of Nye County?
Total Female Population of Nye County is 25,408.
What is the Ratio of Males per 100 Females in Nye County?
There are 103.47 Males per 100 Females in Nye County.
What is the Ratio of Females per 100 Males in Nye County?
There are 96.65 Females per 100 Males in Nye County.
What is the Median Population Age in Nye County?
Median Population Age in Nye County is 52.9 Years.
What is the Average Family Size in Nye County
Average Family Size in Nye County is 2.8 People.
What is the Average Household Size in Nye County
Average Household Size in Nye County is 2.3 People.
How Large is the Labor Force in Nye County?
There are 18,512 People in the Labor Forcein in Nye County.
What is the Percentage of People in the Labor Force in Nye County?
41.8% of People are in the Labor Force in Nye County.
What is the Unemployment Rate in Nye County?
Unemployment Rate in Nye County is 9.3%.